|
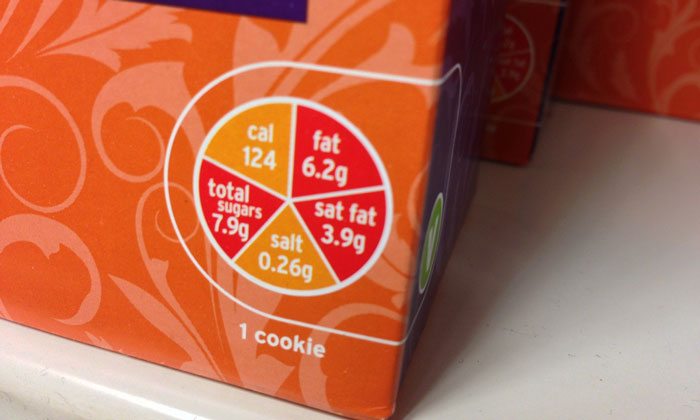
The shopping list is ready and you are at the supermarket to pick and choose the essentials for the month. Though you might be doing it on a weekend there isn’t much leisure time to shop at your desired pace. In such situations, it would be extremely helpful if the nutrition labels present in the pack is color-coded for quicker understanding, isn’t it? Nutrition labels on food products help us choose between various products and restrict our consumption of foods that’s high in fats, sugars and salt. The information provided is for 100 grams or per portion of the food and nowadays, due to increased interest in choosing healthier food options food manufacturers are highlighting fat, salt, sugar and energy content on the front of the packaging along with reference intake values. Some of these nutrition labels use colour codes such as red, amber and green and this helps us decode the fat, salt and sugar content of the food in a glance.
This color-coded labelling is also called as ‘traffic light’ labelling that has been proposed as a public health intervention to minimize obesity risk by attending to the dietary intake of individuals. These occur as a part of the front-of-pack (FOP) nutrition rating systems that clearly detail the calories and nutrients present within the food pack. We already have studies that have given a green signal to traffic light food labelling as an excellent initiative to fight against obesity and a modelling study in Australia found it to be a cost-effective method for preventing obesity. Studies of summary indicator FOP systems show that this system is in fact efficient enough to promote healthier product reformulations by manufacturers-this was seen in Canadian manufacturers where they successfully reduced sodium in foods by 80-150 grams. There are different studies that show that sodium, fat and sugar consumption could be reduced if individuals replaced their regular foods with those that follow the FOP system criteria. Canadian Study on Replacing ‘Red’ Label Foods with Healthier Options: A Nutrition Analysis Fat, energy, sodium and sugar intake of Canadian adults were calculated using data from the Canadian Community Health Survey, Cycle 2.2 Nutrition (CCHS 2.2)- a national survey that’s aimed at providing authentic data regarding food and nutrients intake of Canadians. The CCHS 2.2 included a sample of 35,107 individuals aged 0 years and above whose food and nutrients intake was calculated through a 24-hour dietary recall. The present research primary included Canadian adults aged 19 years and above, excluded pregnant and breastfeeding women and also those whose food intake data was not available. The different foods consumed by individuals were color-coded in red, amber or green depending on the criteria for food and drinks described in the UK’s ‘Guide to Creating a Front of Pack (FoP) Nutrition Label for Pre-packaged Products Sold Through Retail Outlets’. This was used as the measure to compare against the fat, sodium and sugar intake of foods and drinks. Those foods that had red color codes were replaced with similar foods that did not have the code for any of the nutrients. Whenever possible, the original food was replaced by the same food from a different brand that provided a healthier option and every effort was taken to ensure that the replaced food was as good as the original choice. For instance, lean ground beef was replaced with extra lean ground beef. There were also instances where some foods were replaced by the same foods but prepared in a much more nutritious manner. But when replacement was not possible the foods were not replaced. Results Totally, Canadian adults consumed 5655 unique foods and 495 unique beverages and it was found that 52% foods and 13% beverages contained at least one nutrient that qualified for a red traffic light. On analysis, it was seen that sodium was the nutrient associated with most (27%) red traffic lights while sugar was the nutrient that was least (14%) associated. For beverages, sugars was the nutrient that was mostly (10%) linked to red traffic lights while sodium and fats were least associated (2%). Though replacements for all foods were not possible, the percentage of foods and beverages that qualified for at least one red traffic light dropped to 40% and 2% respectively. The traffic light food labelling helped Canadian adults reduce their overall intake of energy, total fat, saturated fat and sodium compared to baseline-calorie intake reduced by 5%, total fat by 13%, saturated fat by 14% and sodium by 6% among Canadians. Men reaped maximum benefits as they consumed 122 fewer calories, 12 g less total fat, 4 g less saturated fat and 199 mg less sodium under this food labelling model. The only nutrient that did not show considerable change was sugar. It was amazing to find that total intake of calories and fat were reduced to below recommended Daily Values and this included women’s total intake of saturated fats as well. This study shows that the traffic light labelling system has a positive impact on the individuals’ total nutrient and calorie intake decreasing the consumption of fats, sugars and sodium. Sustenance of Dietary Changes Possible with Traffic Light Diet The Massachusetts General Hospital (MGH) studied the nutrient intake of their employees implementing the traffic light diet in their hospital cafeteria with simple ‘traffic-light’ symbols-the program was devised such that green labels indicated healthiest foods, yellow labels indicated less healthy foods and red labels the least healthy ones based on positive and negative criteria. Details whether the main ingredient was fruit, vegetable, whole grain and likewise with the amount of saturated fat was also mentioned. The food habits of 5,695 employees were tracked via the purchases made once after the labels were added and once again after product-placement changes made healthier choices accessible. This analysis remained in place for 2 years. Results showed that the purchases of red-labelled foods decreased while the proportion of green-labelled foods purchased increased. Such kind of labelling paved way for greater calorie reduction over the two-year period with the red-labelled foods contributing to major calorie reduction. On the whole, besides reducing total calorie intake the employees were also eating nutritious foods that contribute towards their total calorie intake. Some employees even lost up to 2 kg over time. This is not a weight loss program but one that aims at achieving a steady weight maintenance by individuals instead of allowing them to gain weight. This might be a good start for reversing the obesity epidemic. Organizations conduct wellness programs that help improve well-being of employees but such programs happen only for a short period. But this kind of an intervention is a continuing affair where people are exposed to it daily at work and in the long run it becomes a lifestyle practice. The traffic light labels could be implemented in all workplaces as employees love to eat well but don’t have enough time to read and decide. In such scenarios, the labelling helps them realize when they are about to make an unhealthy food choice and motivate them to choose a better option. Green, Amber & Red: What Do Each of the Colours Stand For? The colour codes depict whether a product is high (red), medium (amber) or low (green) in saturated fats, fat, salt and sugar and the total energy provided by it. Going by the color codes helps you choose the right food. For instance, if you would like to go for a veg roll read the color codes to decipher the nutrient content: Green: If the label is mostly green this is a clear indication that the food is low in that nutrient (fat, sodium or sugar) and you are about to make a great choice. Amber: This is an indication that the product is neither low nor high in that nutrient and it is always ok to eat foods that have amber on the labels any time. Red: This is not a declaration to avoid such foods totally but a warning sign that they are high in fats, sugar and sodium. It is always recommended to decrease consumption of red-labelled foods and if you wish to have them, eat them as rarely as possible in minimal quantities. References Traffic-light Labels Could Reduce Population Intakes of Calories, Total Fats, Saturated Fats and Sodium: https://www.ncbi.nlm.nih.gov/pmc/articles/PMC5300258/pdf/pone.0171188.pdf Traffic Light Food Labels Reduce Calories Purchased in Hospital Cafeteria: https://www.sciencedaily.com/releases/2019/07/190710134014.htm Helping You Eat Well: https://www.nutrition.org.uk/healthyliving/helpingyoueatwell/324-labels.html?start=3 Comments are closed.
|
AVOID FRAUD. EAT SMART+91 7846 800 800
|
- Home
- Written Testimonials
- Consult
- Clinics
- Blogs
-
Diet & Nutrition
- Diabetes Reversal
- IVF IUI not needed for PCOS PCOD Infertility
-
Medical Nutrition
>
-
Disease & Conditions
>
- Infertility | PCOS
- Diabetes Mellitus
- Cholesterol
- Hypothyroid
- Kidney Problems
- Hypertension
- Cardiovascular Diseases
- Liver Diseases
- Gastro intestinal disorder
- Cancer
- Metabolic Disorders
- Orthopedic Disorders
- Eating Disorders
- Dietary Recall
- Weight Record Filled By Clients
- Online Payment Transaction Details
- Online Clients Weight Check Form
- Our Program Package Service Charges
- Weight Record 2017 Clients
- Measurements sent by Clients
- Terms & Conditions Of Payment
- Thanks. Your Form is Submitted
- Video Testimonials
- Lifestyle & Wellness
- Lifestyle & Wellness Blog
- Allergy & Intolerance
- Weight Loss / Gain
- Weight Loss / Slimming Blog
-
Disease & Conditions
>
- Life Cycle Nutrition >
- Sports Nutrition >
- Integrity in Nutrition
- Knowledge Centre
© COPYRIGHT 2022. ALL RIGHTS RESERVED. FRST HEALTHCARE PVT LTD.
Dr. Nafeesa Imteyaz of First Eat Right clinic, is the Best Dietitian Nutritionist in Bangalore. Best Dietitian Nutritionist in Pune. Best Dietitian Nutritionist in Hyderabad. Best Dietitian Nutritionist in Chennai. Best Dietitian Nutritionist in Mumbai. Best Dietitian Nutritionist in Delhi. Best Dietitian Nutritionist in Kolkata.


