 Does Your Kid Show Excessive Interest in A Specific Object or Social Activity? Children born during earlier days were underweight or overweight, tall or short and fair or dark. It was rare that a child was born with defects. But now, we perform multiple scans on the pregnant mom to check on the health of the fetus due to fear of multiple health problems that crop up these days. Children born preterm are at an increased risk of autism spectrum disorder (ASD) with earlier deliveries garnering increased risks. Almost 5% of kids with a birth weight <2000 grams and 8% of those born <26 weeks of gestation are at a higher risk of ASD. ASDs are neurodevelopmental pathologies impairing social competencies and patterns of behaviour. Diagnosis is made purely based on observing the behaviour of the child and can be confirmed with any two of the following symptoms occurring repeatedly-repetitive patterns of behaviour, interest and activities, and lingering difficulties in social communication and interaction. Though we do come up with various proposals behind the occurrence of this condition none of them can justify the cause of the disorder on their own. It is widely accepted that both genetic and environmental factors contribute to the development of ASD but studies show that only 30% cases are clearly linked to these causes leaving the rest to assumption.
Worldwide, 0.76%-1.46% individuals suffer from ASD and over the past couple of decades the rates are steadily increasing for reasons unknown-some quote improved awareness in diagnostic criteria while some others propose changes in environmental factors to be potential contributors for this increase in rates. Despite advances in medicine and science we don’t have a proper curative treatment for ASD, a disorder that’s currently increasing at rapid rates. This has invoked many families (almost 28%) to rely on complementary and alternative medicine (CAM) to treat patients with ASD despite the long-standing fact that there is no scientific proof for this except in the case of melatonin. There have been many proposed diets, ingredients and foods that benefit kids with ASD but all of them without much proofs. Omega-3 fatty acids are one among these used by more than 28% kids with the disorder despite sufficient evidence to back up its benefits. Omega-3 fatty acids are polyunsaturated fatty acids (PUFA) found in three main types in the human diet-ALA (alpha-linolenic acid), DHA (docosahexaenoic acid), and EPA (eicosapentaenoic acid). DHA and EPA are found in seafood, while ALA is found in nut and plant oils. DHA and EPA can be synthesized from ALA by the human body but none of them can be synthesized from scratch. PUFAs have always occupied limelight when it comes to psychiatric diseases and evidences do show that PUFA deficiency is linked to neurodevelopmental problems such as schizophrenia, ASD and bipolar disorder. PUFA has an anti-inflammatory effect which has been proposed to be helpful in brain function but because they cannot be synthesized by the human body it can cause an imbalance in PUFA levels which might be one of the reasons why we see increasing number of ASD cases nowadays. Omega-6 and omega-3 fatty acids are the two main PUFAs whose consumption must be 1:1 to 4:1. But the lifestyle and dietary habits presently lead to increased intake of omega-6 fatty acids once again increasing the risk of psychiatric diseases. All these make one thing clear-omega-3 and omega-6 fatty acids might hold a bigger role in affecting psychiatric conditions in individuals when taken in the right quantities. Systematic Review of Clinical Studies Reporting Effective Treatment of Omega-3 Fatty Acids There have been studies reporting poor concentration of omega-3 fatty acids in kids with ASD compared to controls and also in those with schizophrenia and ADHD. Yet another recent study supported the positive effects of fatty acids on treating people with depression. A group of researchers conducted a systematic review to research on all prior clinical studies that reported effective treatment of this fatty acid on kids with ASD. Databases such as MEDLINE and EMBASE were searched using key terminologies and various exclusion criteria to pick the appropriate studies that would suit the needs of the researchers. The team used letters to provide consent whether or not the fatty acids could be used to treat patients with ASD. A or B was used to denote that treatment should be provided to patients, C grade indicates that treatment should not be offered routinely and D grade shows that treatment should never be given. Though the database came up with 143 articles only 6 of them satisfied the inclusion criteria. Of this, only 1 was a randomized control trial which included 13 children with autism who were either assigned to 1.5 grams of omega-3 fatty acids or a placebo for 6 weeks. The aberrant-behavior checklist which included items such as hyperactivity and sensitivity showed improvements in the group consuming fatty acids but none of them were statistically significant. 4 studies were uncontrolled and open-label ones that had kids or adults with autism as participants. A study was done by Politi et al. done on 19 adults with a mean age of 29 suffering from severe autism, moderate to greater mental retardation and maladaptive behaviors. They were given 0.93 grams of fatty acid (DHA+EPA) and a vitamin supplement (5 mg of vitamin E daily). There was no improvement seen in any of the problematic behaviours while there was improvement in both severity and frequency of symptoms in the post-treatment period. Meguid et al. treated 30 children with autism for over 3 months using both omega-3 and omega-6 fatty acids and vitamin E. While 20 of the 30 kids showed improvement in the Childhood Autism Rating Scale there was no mean change observed in the group of 30 children. Another study by Patrick et al. on 22 kids given a daily capsule of omega-3 acids for 3 months showed that there was a significant increase in subscale assessments of basic language and learning skills from day 0 to 90. Bell et al. who studied 9 kids with Autism or Asperger’s were given one of two different omega-3 fatty acids of varying doses for 6 months. Though specific values did not show tremendous improvement there was an overall improvement in general health and other measures. Another study on an 11-year-old boy with autism right from age 2.5 suffering from anxiety and agitation showed that supplementing fish oils at 3g/day proved that there was complete elimination of anxiety and agitation after 1 week and the improvements were stable after 8 months of follow-up. The different study results show that there is insufficient evidence backing the benefits of omega-3 fatty acids on treating autism. Omega-3 & Omega-6 Fatty Acids & Effects on Kids with Autism A study conducted for knowing the effects of both omega-3 and omega-6 fatty acids on kids with autism included 565 children with attention deficit hyperactivity disorder (ADHD, n=401), ASD (85) or controls (n=79) aged between 3 and 17 years. Those with ASD were younger than those with ADHD or the controls. All kids and parents underwent a series of tests and questionnaires that included: The tests of variables of attention (TOVA) version 7 that analysed attention and impulsivity, The Australian Twin Brother Rating Scale (ATBRS) which rated 20 items on a scale of 0-3 where 0 means not at all and 3 means very much/very often and, Childhood Autism Rating Scale (CARS) that comprises of 15 scales measuring various things such as anxiety reaction, verbal communication, activity level, etc. and fatty acid analysis. Results showed that kids with ADHD and ASD had lower erythrocyte DHA, lower EPA, lower AA, higher AA/EPA and lower n-3/n-6 ratio than controls. Kids with ASD had lower DHA, EPA and AA and higher n-3/n-6 ratio than kids with ADHD. Kids with ADHD and ASD had lower levels of n-3 PUFAs EPA and DHA. Such lower levels of DHA, EPA and n-3/n-6 ratio and higher AA/EPA ratio was linked to greater severity of symptoms. DHA levels in the study reported 2.28% for kids with ADHD, .85% for ASD and 4.72% for controls. It was evident that lower DHA levels showed poorer reading and greater ADHD-type behaviour. Another study by Brigandi et al. showed that DHA levels were 1.4% in the erythrocyte membranes in kids with autism compared to 1.76% in controls. This shows that a value of 0.85% in the ASD group is very low. There is an improvement in reading and ADHD-type symptoms observed in kids who do not have ADHD when treated with EPA plus DHA or DHA. There are various studies showing marked improvements in kids with ADHD when they were given a supplement containing a 3/1 ratio of EPA/DHA showing that EPA has stronger effects than DHA. A study by Milte et al. on kids supplemented with high DHA, EPA or omega-6 showed that increased EPA or DHA was linked to improved cognition and behaviour and this association was strongest for DHA. The DOLAB study that supplemented school children with poor reading performance with DHA showed improvement in parent-rated ADHD-type symptoms and reading performance too. Omega Supplementation in Toddlers Preterm infants are at a higher risk of ASD and finding the effectiveness of omega-3 and 6 fatty acids could help kids. A pilot trial and a full-scale trial supplementation was done on toddlers born preterm and showing ASD symptoms. Preemie Tots Trial: This is a randomized, placebo-controlled trial which included children aged between 18 and 38 months born ≤29 weeks of gestation. Those children who tool FA supplements, fatty fish or growth-promoting beverages with DHA ≥2 times/week were excluded apart from enforcing several other exclusion criteria. Parents of potentially eligible kids were asked to complete a questionnaire containing screening tools to assess early ASD symptoms which contained the Pervasive Developmental Disorder Screening Test II, Stage II (PDDST-II), the Brief Infant Toddler Social and Emotional Assessment (BITSEA) and another one from Ages and Stages Questionnaire-social emotional for assessing joint attention. All the kids were assigned to one of the two color coded groups (2 treatment and 2 placebo). The treatment group underwent 90 days of daily oral FA supplementation with lemon-oil-flavoured fish and borage oil and the placebo group was assigned to a daily intake of canola oil. All the 31 participants selected after imposing various exclusion criteria were born at a mean of 27 weeks of gestation, were at a mean of 27 months old at enrolment and were males comparatively. Their mean PDDST-II score was 6 and the cut-off for evaluation for ASD ≥5. Almost 74% of the participants scored in this range. At the end of the 3-month study parents reported improvement on the behaviour-rating scale in both treatment and placebo group. The treatment group showed greater improvement on the BITSEA ASD scale than the placebo group. The study team continued to observe the participants and by Jan 2017 all the kids were around 70 months old and 12 of them received a diagnosis for ASD (2 in the treatment group and 3 in the placebo group had diagnosis, 4 in the treatment group and 3 in the placebo group had symptoms noted). There was an increase in the concentration of EPA, DHA and total n-3 fatty acids. The treatment group experienced larger increase in erythrocyte EPA and DHA with decrease in LA, AA and docosapentaenoic acid (DPA) and the placebo group experienced no notable changes in FA concentrations. References Omega-3 Fatty Acids for Autism Spectrum Disorder: A Systematic Review: https://www.ncbi.nlm.nih.gov/pmc/articles/PMC2710498/ Omega-3 & Omega-6 Polyunsaturated Fatty Acid Levels & Correlation with Symptoms in Children with Attention Deficit Hyperactivity Disorder, Autism Spectrum Disorder & Typically Developing Controls: https://journals.plos.org/plosone/article?id=10.1371/journal.pone.0156432 Omega-3 and Omega-6 Fatty Acid Supplementation May Reduce Autism Symptoms Based on Parent Report in Preterm Toddlers: https://academic.oup.com/jn/article/148/2/227/4913038 Supplementation of Omega-3 Fatty Acids May Improve Hyperactivity, Lethargy & Stereotype in Children with Autism Spectrum Disorder : A Meta-analysis of Randomized Control Trials: https://www.ncbi.nlm.nih.gov/pmc/articles/PMC5634395/  Eat Your Meal for Reaping Breakfast Benefits  Not only A Treat to the Eye but One to Our Body as Well Not only A Treat to the Eye but One to Our Body as Well Breakfast, the most important meal of the day, is still undervalued and given lesser prominence than deserved. Man lives by his own set of preferences and priorities in which eating a healthy morning breakfast exists down in the list for most people. We become our own nutritionists and dietitians dictating food intake practises and diet routines to achieve several goals including weight loss, fat loss and more. In this process, breakfast becomes the most affected meal of the day as we skip it based on multiple factors such as absence of time to prepare food and eat, weight loss strategies or calorie restrictions. We skip breakfast 1, 2, or even 3 times a week and for some others eating breakfast is a luxury indulgence when they have time. Such repeated instances of breakfast skipping have been associated with a number of health problems including cardiometabolic risks, obesity, insulin insensitivity and type 2 diabetes. Besides affecting the health of the individual skipping breakfast makes a person sluggish, lose concentration, lack focus and optimal memory skills and perform not up to the expected standard.
Type 2 diabetes mellitus (T2DM) prevails as one of the leading causes of morbidity and mortality rates worldwide owing to our unhealthy lifestyle and dietary practises. Unbalanced blood sugar levels bring about microvascular (retinopathy, nephropathy and neuropathy) and macrovascular (coronary artery disease and cerebrovascular disease) complications that contributes to increased medical expenses and health degradation too. Aichi Workers’ Cohort Study Japan has a 10.2% diabetes rate in male workers aged between 40 and 69 years and a 4.7% rate in female workers in large-scale companies in 2008-2010 and 15.0% in men and 8.0% in women in the National Health and Nutrition Study in 2011. Almost 14.4% men and 11.1% women skip breakfast which is a modifiable risk factor for T2DM and finding out the reason behind this can help us correct the risk and lead a healthier life. This motivated a group of researchers to extract data from the Aichi workers’ cohort study that included 6648 Japanese civil servants in Aichi prefecture aged 35-66 years in 2002. All of them answered a questionnaire regarding their lifestyle and medical history and were followed up until 2011. T2DM prevalence in the participants were examined through two methods: One, by noting down the year when fasting blood glucose (FBG) levels reached ≥126 mg/dL and the date of onset was set as July 1st. Second, the answers from the questionnaires helped the researchers know the existence of diabetes in patients and the year of onset. All the participants were probed for their breakfast habits using yet another self-administered questionnaire and eating frequency was assessed using five categories-every day, almost every day with occasional skips, 3-5 days/week, 1-2 days/week and none. Using the frequency response all the participants were split into two groups-breakfast eaters (included those who reported eating breakfast every day and almost every day with occasional skips) and breakfast skippers (all the other categories). The brief-type dietary history questionnaire (BDHQ) included data on intake of fish, fruits, vegetables, whole-grains, cereals, coffee, sugar-sweetened beverages and snacks and also speed of eating classified as very fast, relatively fast, medium, relatively slow and slow. Height, weight, BMI, blood glucose levels and insulin concentration were noted down. The participants were analysed for their smoking habits classified as current, former and never; the number of days they were engaged in physical activity classified into two categories ≥3 days/week or <3 days/week. Work timings were noted and scheduled into 4 categories-shift work including night shifts, shiftwork but without night shifts, without shiftwork but with night work and without shiftwork or night work. Sleep duration was classified as <7h or ≥7h and stress was classified into 4 categories including very much, much, ordinary and little. Results Of the 4631 who participated 90.4% ate breakfast. On a comparative basis, those who skipped breakfast were following a worse lifestyle that included current smoking, alcohol consumption, increased intake of sugar-sweetened beverages and decreased intake of fruits and vegetables. Results showed that:
Chronotype as a Middle Man between Skipping Breakfast & Type 2 Diabetes Incidence Cross-sectional and longitudinal studies show increased cardiometabolic risk in kids and adults who skip breakfast. A long-term study spanning more than 20 years showed that those who skipped breakfast at childhood and adulthood showed greater waist circumference and higher fasting insulin, total cholesterol and LDL cholesterol than those who eat breakfast. A big-scale long-term study spanning more than 16 years on 29,206 participants showed that skipping breakfast was associated with a 21% increased risk of type 2 diabetes. But, a study on low-income Latino diabetic patients showed that breakfast skipping was linked to increased plasma glucose levels but not haemoglobin (HbA1C) levels that’s generally taken as the standard for diabetes measurement. The circadian cycle ensures regulation of a number of daily physiological rhythms including sleep/wake and feeding behaviour, peripheral tissue metabolism, energy expenditure and hormonal profiles. Each of us are at our peak energy levels at different times during the day-some during the early morning hours called as ‘morning lark’ and some during late nights called as ‘night owls’. The chronotype of the individual can be deduced from self-reported sleep times. We all love to stay late nights and get up even later but a study shows that those who do so are at a 2.5 times higher risk of type 2 diabetes which in turn indicates that a later chronotype keeps the individual at a higher risk of T2DM. Likewise, those with a later chronotype often eat less or skip eating altogether after waking up late in the morning. These individuals prefer to eat more of alcohol, fat and cholesterol, especially during dinner compared to those with an early chronotype. Maybe that’s why late risers probably suffer from poor glycemic control. A study focused on knowing more about the role of chronotype in patients with T2DM and skipping breakfast. The study team invited patients from the Rush University Medical Centre and once chosen all of them self-reported age and race, recorded height, weight, BMI and entered the recent Hb1Ac values. Bedtime, wakeup time, sleep onset latency and sleep duration both during weekdays and weekends during the previous month was recorded. Mid-sleep time as the midpoint between sleep onset and wake time was calculated and mid-sleep time on free days (MSF) was arrived at from mid-sleep time on weekend nights with adjustments for sleep duration on weekend nights was calculated. SDF is calculated sleep duration on weekend nights and SDw is calculated sleep duration on weekday nights. All the participants mentioned their perceived actual sleep duration and preferred sleep duration on weekdays. They answered a 24-h dietary recall to know about the content and timing of the meal over the previous day. Total calorie intake over the day was also calculated using this data. Results Comparison between breakfast eaters (n=172) and breakfast skippers (n=22) showed that those who skipped breakfast were significantly younger and had higher HbA1c levels and BMI but had no difference between groups in median diabetes duration, insulin use or number of diabetes complications. Those who skipped breakfast generally had a later chronotype as their bedtime routine was later than those who ate breakfast. More number of breakfast skippers complained of lack of appetite during morning hours and reported consuming fewer total calories during the previous day. These guys consumed a major portion of their calories during lunch and dinner compared to those who ate breakfast. It was seen that breakfast skipping was associated with significantly high HbA1c levels. To see the effect of chronotype on diabetes and breakfast skipping a series of regression models were performed. In the first model, skipping breakfast was linked to higher HbA1c levels and in the second model it was linked to later MSF. In the third model MSF was linked to HbA1c and the fourth model suggested that MSF and breakfast skipping was linked to higher HbA1c. Chronotype did not entirely have an impact on breakfast skipping and HbA1c levels but it was seen that both chronotype and breakfast skipping remained independently linked to poor glycemic control. Behavioral interventions in the form of eating breakfast or modifying sleep time could be considered strategies for improving glycemic control in the participants. Other Studies The meta-analysis results from 2015 showed a direct link between breakfast skipping and type 2 diabetes risk but we don’t have any dose-dependent studies until now that can confirm whether skipping once a week would be less destructive than skipping twice per week. It is also not right to categorize all those who skip breakfast into one single category without paying heed to the frequency of times as this does have an important impact on the results. A meta-analysis of studies on skipping breakfast and type 2 diabetes using two random-effects models was done-standard random-effects model meta-analyses and dose-dependent meta-analysis. Though six studies met the inclusion criteria only 4 had BMI data. The standard random effects meta-analysis showed a 32% increased type 2 diabetes risk before adjusting BMI and a 22% increased risk after adjusting for BMI. Pooled RR value was 1.06 suggesting an increased risk of 5% after adjusting for BMI. There was an increased risk of 55% seen for 4-5 days of skipping breakfast/week before adjusting BMI and an increased risk of 40% after adjusting for BMI. It was observed that prolonged periods of fasting including skipping breakfast led to an increased postprandial insulin resistance during the next meal and increased ghrelin (hunger hormone linked with weight gain) levels as well. But we also have data showing that intermittent fasting, alternate day fasting and daily calorie restriction helped reduce diabetes risk factors such as body weight, viscera fat, fasting insulin and insulin resistance and we need long-term trials to confirm anything. Glucose concentration and markers of insulin resistance (such as high cholesterol and inflammation) are higher after lunch on days when individuals skipped breakfast. This inflammation affects insulin sensitivity thereby increasing one’s risk for obesity and type 2 diabetes. It is always recommended to start the day on a healthy note with fruits, whole grains, milk, eggs and nuts while avoiding high-sugar and processed foods. References Breakfast Skipping is Positively Associated with Incidence of Type 2 Diabetes Mellitus: Evidence from Aichi Workers’ Cohort Study: https://www.ncbi.nlm.nih.gov/pmc/articles/PMC4411234/ The Relationship between Breakfast Skipping, Chronotype & Glycemic Control in Type 2 Diabetes: https://www.tandfonline.com/doi/abs/10.3109/07420528.2013.821614?journalCode=icbi20 Breakfast Skipping & Type 2 Diabetes: Where Do We Stand? https://academic.oup.com/jn/article/149/1/1/5280617  Eyes are Windows to the Soul, Take Care of Them Wisely  Eat all Fruits & Veggies Besides Green Leafy Vegetables for Maximized Lutein Absorption Eat all Fruits & Veggies Besides Green Leafy Vegetables for Maximized Lutein Absorption Some nutrients are synthesized by the human body while some aren’t and must be acquired by consuming those foods that are rich sources of these nutrients. These are called as essential nutrients which includes vitamins, minerals, proteins, fats, water and carbohydrates. Nutrition is integral for human health which includes proper functioning of all body parts and organs including the human eye as well. Our eyes provide us with vision and this is extremely important for our day-to-day functioning and a good quality of life. Despite this, we don’t take proper care to maintain a good eyesight by consuming those foods that cater for good vision. The most important causes of visual impairment include cataracts, glaucoma, age-related macular degeneration (AMD) and diabetic retinopathy. Statistics show that cataract and AMD cases are only going to increase in numbers in the coming years which requires intervention as soon as possible.
Intervention strategies are usually in the form of nutrient intake and when we talk about eye health one cannot but mention the involvement of lutein and zeaxanthin. Lutein and zeaxanthin are carotenoids that are together referred to as xanthophylls or macular pigment accumulating in the macular region of the retina and protecting the retinal cells needed for vision. Besides being integral for eye health lutein is also absolutely necessary for memory and brain function. It is known that improving brain health in adults is not easy and our target should be to improve nervous system functioning in infants when they are still in the development stage. Carotenoids are plant bioactive compounds that cannot be synthesized by mammals but must be consumed in the form of fruits and vegetables. But this doesn’t make lutein and zeaxanthin essential nutrients and research is still going on whether they should be included in the list too! Lutein is amazingly present in the cord blood at the time of delivery of the newborn transferred to the fetus via the placenta which makes the lutein concentration in the newborn dependent on the maternal concentration levels. Soon after birth the newborn receives lutein from mother’s milk. Studies on carotenoids concentration in breastmilk show that they are dependent on maternal dietary intake. This means that every newborn has different lutein levels as every mother follows a different dietary routine. Analysing breastmilk carotenoids might be the best way to find the link between maternal, breastmilk and infant carotenoids status. Carotenoids Levels in Infants: A Poland Study This was a study that consisted of three study sessions at the 1st, 3rd and 6th month of lactation during which breastmilk samples were collected, anthropometric measures assessed in infants as well as mothers, mom’s psychological state evaluated and the infant’s psychomotor development measured during the 6th month. All the participating moms were requested to fill a questionnaire that enquired about their lifestyle, health and nutrition during the preconception, prenatal and postnatal periods. The study was thrown open to anyone between 18 and 45 years of age who had given birth to a single, healthy infant. After applying exclusion criteria, the study included 53 mother-infant pairs. Most mothers had normal BMI during the first month of lactation, 78% of them had a normal weight at the third month and 85% during the sixth month. 47% were bearing their first child and 53% of the infants born were females. All the participants were requested to collect breastmilk at home: pre-feeding and post-feeding breastmilk was collected 24 hours prior to each study visit during 4 different time periods to compensate for any difference in carotenoid concentration. Macronutrient composition including energy and fat content was analysed three times and the average was used for comparisons. Carotenoid concentration was assessed using milk samples with the help of high-performance liquid chromatography. A 3-day dietary recall was taken at the 3rd and 6th month of lactation which helped the researchers predict macronutrient and micronutrient intake. These were used to calculated dietary fibre and fatty acid profiles. Lutein and other nutrient intakes were calculated and dietary data and supplement information was noted. Height, weight and BMI measurements were taken for all participating mothers. Results
Lutein Content: Mother’s Milk Versus Infant Formula Some infants don’t accept breastmilk and the parent is forced to feed them infant formula which drastically differs in lutein concentration compared to mother’s milk. Human milk contains higher concentrations of the carotenoid comparatively. A study in Poland enrolled exclusively formula-fed and breast-fed infants born between 37 and 42 weeks of gestation for a 12-week study period. Inclusion criteria included that mothers of these infants consumed at least 6 cups of dark green leafy vegetables (good sources of lutein) per week. Lutein fortification in infant formula was to be 20, 45, 120 or 225 mcg lutein per liter of formula. Formula-fed infants were fed with any one of the four study formulas. Human milk was expressed using a breast pump and a mid-afternoon sample represented the 24-h concentration of lutein. 40 infants were enrolled in the study of which 14 were fed with human milk and 26 were fed with formula milk. 6 of them could not complete the study leaving the researchers with 34 of them. Results showed that mean lutein concentration in human milk samples were similar at weeks 4,8 and 12. Lipid content was 41.5 g/l, lutein content was 21.1 mcg/l and average amount of lutein per gram of milk fat was 0.492 mcg. Infants fed with mother’s milk had higher lutein concentration than any of the infants fed with any of the four study formulas. But lutein concentration did increase from baseline in all formula-fed infants except in the unfortified group. After the 12-week study period human milk-fed infants had a 6-fold higher mean serum lutein concentration than the unfortified formula-fed infants. Lutein levels did increase in formula-fed infants as well depending on the dose of lutein fortification given at the end of the 12-week period. Serum lutein concentration increased by 3.7 mcg/l for every 1 mcg/l increase in human milk lutein concentration in breastfed infants but it was only 0.9 mcg/l for every 1 mcg/l increase in formula lutein concentration in infants fed with formula milk. Clearly human milk-fed infants had greater lutein concentrations compared to formula milk-fed infants. Breastmilk Facilitates Lutein Absorption Carotenoids protect our eyes (through absorption of blue light) by safeguarding the retina where they are highly concentrated. Lutein and zeaxanthin are transported in plasma in LDL and HDLs. In vitro studies show that lutein was delivered to cells by LDL via the LDL receptor while zeaxanthin was delivered by HDL via a scavenger receptor. The brain and the retina contain a lutein-binding protein called the steroidogenic acute regulatory domain protein (StARD3) whose concentration depends on the lutein concentration available in both these body organs thereby playing an integral role in lutein intake. We have studies showing that there is an increased absorption of lutein from breastmilk compared to formula but another study has taken it a step forward proving that there is not only increased absorption in the plasma but also increased deposition of lutein in the retina and brain. The researchers theorized that increased lutein absorption from milk might be due to two factors that differ in formula: the milk-fat globule structure and milk lipases. Lutein is a fat-soluble carotenoid that actually requires fat for optimal absorption. So, lipid structure in the feed affects lutein absorption. Whereas the infant formula used in this study has a simple fat structure that’s based on high-oleic safflower oil, soybean oil and coconut oil. Formula lipids are designed in a certain way to increase shelf life and such a difference in lipid architecture could be one of the reasons for increased lutein absorption in breast milk compared to formula milk. Besides this difference, formula milk also lacks key bioactive ingredients from the mother that’s present in human milk-lipases. Lipases help in lipid digestion within the infant gut and this absence in formula milk once again leads to decreased lutein absorption. Lipases and structure differences in the milk-fat globule lead to enhanced carotenoids absorption from breast milk and this shows that infant formula cannot rely on supplements as a means to increase lutein concentration. It is ideal that researchers use blueprint of milk as a model to design novel lipid formulations with the right kind of architecture for increased absorption and improve enzyme presence for enhanced carotenoid delivery. First, this once again reinstates the fact that every mom should breastfeed unless it’s an unavoidable circumstance. Second, moms should ensure to increase their consumption of fruits and vegetables for increased dietary intake of lutein and zeaxanthin. Maximize intake of eggs, corn, kiwi, squash, pumpkin, spinach, orange and green bell pepper, cucumber, seedless grapes and peas for significant lutein absorption by the body. References Serum Lutein Concentrations in Healthy Term Infants Fed Human Milk or Infant Formula with Lutein: https://link.springer.com/article/10.1007/s00394-009-0047-5 Carotenoid Content in Breastmilk in the 3rd and 6th Month of Lactation & its Associations with Maternal Dietary Intake & Anthropometric Characteristics: https://www.ncbi.nlm.nih.gov/pmc/articles/PMC6356523/ How Does Breast Milk Enhance Lutein Absorption? https://academic.oup.com/jn/article/148/1/1/4823729 Fruits & Vegetables that Are Sources for Lutein & Zeaxanthin: The Macular Pigment in Human Eyes: https://bjo.bmj.com/content/82/8/907  Moms! Its your Gestational Intake using which your Fetus Survives & Develops  Supplements are a Regular Routine in Every Woman’s Life Supplements are a Regular Routine in Every Woman’s Life Children are replicas of their moms and dads mostly with some of them not bearing any attributes of their parents which is rare. Personality and characteristic trait are genetically transferred which makes us gloat with glory when the child behaves like his/her parent. Reproduction is an indispensable part of every person’s life that adds meaning to our existence and helps in taking our family’s virtues and ideologies to future generations as well. But sadly, most women in reproductive age worldwide suffer from obesity/overweight and so younger adults, adolescents and kids. Such high prevalence of obesity during early years has been attributed to several risk factors that affect early during pregnancy in the form of higher maternal pre-pregnancy body mass index (BMI) and excessive gestational weight gain. These risk factors are modifiable ones but when left untreated they do have a serious effect on the infant size at birth and obesity risk later during life. We also have numerous studies showing that maternal obesity/overweight during pregnancy pose as significant risk factors for higher birth weight and neonatal adiposity and also for childhood obesity later. The pregnant mother is the sole means through which the developing fetus acquires all nutrients needed for normal growth and development but maternal pre-pregnancy status and environment also play an equally critical role as pre-pregnancy obesity has the ability to result in foetal macrosomia (where the birthweight ≥4 kg). Once pregnant, the in-utero environment has an upper hand on foetal development including cognitive, organ development and deposition of fat. The environment in which the fetus develops determines the foetus’s genetic transcription affecting it differently depending on the stage of pregnancy. Its isn’t uncommon for the pregnant woman to develop gestational diabetes during any time of pregnancy and the mother’s carbs intake and increase in insulin insensitivity results in higher levels of maternal blood glucose which can be transferred to the fetus besides the foetus’s own insulin production that increases foetal growth and adiposity. Hence, maintenance of maternal insulin levels is absolutely necessary to avoid any deviation in foetal glucose levels. When such is the effect of maternal nutrient intake it is also equally difficult to impose restrictions and help the woman lose weight before pregnancy as most of the pregnancies go unplanned. But once pregnant it is indeed possible to regulate dietary intake levels of the mother-to-be as maternal dietary energy and protein intake affect neonatal anthropometry making food consumption an integral part of the pregnancy process. Gynaecologists prescribe supplements even before the woman becomes pregnant (such as folates) and these continue until delivery of the child. Though maternal micro- and macronutrient intake affects neonatal body composition we don’t have much data available in this field of science as there are quite a lot other factors including physical activity, socioeconomic status, stress, smoking and drug intake that affect foetal growth and development. The study elaborated below uses cohort from the ROLO (Randomised Control trial of Low Glycemic index diet versus no dietary intervention to prevent recurrence of foetal macrosomia) to study the effect of maternal body composition, demographic characteristics, macronutrient intake and lifestyle changes on neonatal weight and adiposity. Cohort from ROLO Study The present study used 542 mother and infant pairs from the ROLO study in which the mothers had given birth to infants with macrosomia previously and hence, were put on a low-glucose diet to decrease the recurrence of macrosomia. Results of the ROLO study showed that the intervention group experienced significant reduction in glycaemic index and load and also had lower gestational weight gain and glucose intolerance but birthweight or risk of macrosomia was not significantly reduced. All the 542 mothers underwent well-being tests, maternal weight, height, BMI and upper-arm circumference were measured during the first antenatal consultation with maternal weight measurements and gestational weight calculations performed during every subsequent consultation. Once the mothers gave birth, neonatal weight, height, mid-upper arm, abdominal, hip and thigh circumference, biceps, triceps, subscapular and thigh skinfold measurements were taken. This resulted in only 266 neonates having complete data of all the measurements taken. The pregnant woman’s macronutrient intake, glycemic intake and glycemic load was measured using a 3-day food diary given during each trimester of pregnancy. Cluster analysis of the food intake resulted in two main clusters of healthy and unhealthy individuals with regard to diet. While the unhealthy cluster ate more of refined foods, white bread, confectionary, chips, processed meats and high-energy beverages the healthy cluster chose to eat more of fruits, vegetables, cereals, fruit juice, low-fat milk and white meat. Dietary intake was analysed using a self-administered 170 item SLAN (Survey of Lifestyle, Attitudes and Nutrition in Ireland) food frequency questionnaire (FFQ) that was given during the initial stages of pregnancy and returned by 28 weeks of gestation. The data in the FFQ was in turn used to create a Dietary Approaches to Stop Hypertension (DASH) index with a score of 0 indicating total non-concordance and 11 indicating total concordance. A glucose challenge test (GCT) was done at 28 weeks of gestation. Result Maternal characteristics did not change between the control and intervention group except for gestational weight gain, glucose intolerance and maternal well-being score. There was no difference in neonatal weight, length or anthropometric measurements between the intervention and control group except in the case of thigh circumference measurement and in the case of neonatal waist: length ratio that was lower in the intervention group. The control group experienced more gestational weight gain than the intervention group. It was also seen that birthweight was associated with gestational weight gain, birth length was negatively associated with maternal smoking, neonatal abdominal circumference was positively linked with maternal saturated fatty acid (SFA) intake which showed a negative trend as the association switched over to polyunsaturated fatty acids (PUFA) intake in trimester 3. Neonatal thigh circumference was negatively associated with frequency of strenuous physical activity, neonatal chest circumference was positively associated with maternal weight and negatively associated with frequency of strenuous physical activity. Neonatal subscapular skinfold thickness was negatively associated with PUFA intake in third trimester, neonatal waist circumference: length ratio was negatively associated with maternal age and positively associated with maternal smoking and maternal mid-upper arm circumference (MUAC) in early pregnancy. The study clearly shows that maternal diet and lifestyle factors were positively associated with the neonate’s body composition. It also shows the significant changes associated with the intake of different foods thereby proving that neonatal central adiposity was positively associated with maternal dietary saturated fat and negatively associated with low GI intervention groups. Healthy Start Study An observational, pre-birth cohort study was done on 1,410 pregnant women aged 16 years and above prior to 24 weeks of gestation after implementing various exclusion criteria. These moms participated in two research visits during pregnancy-the first visit occurred between 8 and 24 weeks of gestation and the second visit occurred between 24 and 32 weeks of gestation while a third visit happened at the hospital after delivery. The newborn baby’s weight, length, head circumference and skin-fold thickness were measured within 72 hours after delivery and the neonatal body composition, fat mass (FM) and fat-free mass (FFM) were calculate from total mass and volume. Maternal pre-pregnancy BMI was calculated using weight measurements and the woman was categorized accordingly and her physical activity levels were measured using a Pregnancy Physical Activity Questionnaire. The diet consumption of the pregnant woman was assessed several times during the study and its quality was assessed using the Healthy Eating Index-2010 that consisted of twelve components giving a maximum score of 100. The study showed a HEI-2010 score between 18 and 89 with a mean of 54.2. Women with a score ≤ 57 were likelier to be obese and have reported of smoking during pregnancy. Lower diet quality was related to younger maternal age, shorter length of gestation and higher energy expenditure. Also, those neonates born to women with this score also had significantly lower birth weight and fat-free mass (FFM) but there was no difference in birth head circumference or birth length between the two groups. Results showed that energy intake as fat and saturated fat was significantly higher in the group with an HEI total score ≤57 but at the same time empty calories were also significantly lower which is a surprising one! Also neonates born to these women had .58% higher fat mass (FM) compared to neonates born to women with a score ≥57. But women with a score ≤57 had no significantly different FFM proving that an increased %FM linked to lower maternal diet quality shows an increase in neonatal FM rather than a decrease in FFM. This large pre-birth cohort showed that lower diet quality had a greater impact on neonatal adiposity, neonates of women with lower diet quality had 24.9 g more fat mass comparatively. Hence, poor maternal diet quality has the ability to increase neonatal adiposity regardless of maternal BMI. Another study on Middle-Eastern women showed that women having a pregestational BMI were at a 2.5 times higher risk of giving birth to low birth weight infants and having a smaller birth height compared to women with a normal BMI while obese women were at a 7.44 times higher risk of giving birth to macrosomic infants compared to women with a normal BMI. References Maternal Low Glycemic Index Diet, Fat Intake and Postprandial Glucose Influences Neonatal Adiposity-Secondary Analysis from the ROLO Study: https://nutritionj.biomedcentral.com/articles/10.1186/1475-2891-13-78 Maternal Diet Quality in Pregnancy & Neonatal Adiposity: The Healthy Start Study: https://www.ncbi.nlm.nih.gov/pmc/articles/PMC5356926/ Impact of Maternal Body Mass Index & Gestational Weight Gain on Neonatal Outcomes among Healthy Middle-Eastern Females: https://journals.plos.org/plosone/article?id=10.1371/journal.pone.0181255  Onset of Various Diseases Follow Macrosomia in Newborn  Stress Affects Quality of Life Greatly & Can be Curbed with Adaptogens  Relief from Stress with Herbs is Amazing Relief from Stress with Herbs is Amazing It isn’t surprising that something new pops up every time we read about health and wellness in the form of superfoods, fad diets or quick fixes for weight loss, weight gain, muscle buildup and more. Adaptogens are the latest buzzword in the wellness world occupying top place in magazines, health blogs and juice bars. The word adaptogen was first coined by a scientist in 1940 when he defined plant-originated adaptogens that bring health upon the human body. An adaptogen is a phytochemical that stabilizes physiological processes and also encourages homeostasis in the body promoting tolerance to stress. Stress is yet another buzzword in today’s world which spares none and attacks everyone right from school-going kids to elderly adults. There is not a possibility of life without stress but we can dismiss it by handling stress in the right way. Stress is a physiological reaction to environmental pressures that can either be self-induced (such as working hard for perfect results or looking to fulfill life’s goals) or even a result of external pressures such as workload, family demands, monetary crunches or societal pressures. Each of us have the potential to withstand stress and perform well under stress but if the same prolongs there are heavy chances that the same affects our personal life too. Stress is the cause for 50% of all lost working days, the root cause for may illnesses such as depression, anxiety, diabetes as well as neurological problems and the factor behind reduced quality of life for many individuals that the World Health Organization has defined stress to be ‘the health epidemic of the 21st century’.
Herbs for Safeguarding Health from Stress There are quite a number of ways proposed for dealing with stress in life including yoga, meditation, exercises, physical activities, hobby classes and more but mankind loves to venture into unexplored territories and come up with new ideas that could benefit humans. Yoga and meditation are tried and tested ways to deal with stress, there are more and more studies coming up on the benefits of physical activity to avoid or displace stress and the latest research is on herbs-a completely new domain that provides ample scope for researchers to try and gain massive information and results. Herbs have been used since thousands of years in Ayurveda and Chinese medicines, occupy prominent roles in culinary domain and are also used as garnishing and fragrance agents. Gardens and terraces are now filled with potted cilantro, basil or thyme plants that bring about an aroma of freshness and herbal gardens are the latest in trend now. Amidst all the behavioral therapies, medications and wellness programs surrounding stress, besides the use of herbs in culinary and medication purposes we now have the latest use of these aromatic agents-as adaptogens. Adaptogens Herbs used in Chinese medication and Ayurveda is not new but the fact that the same herbal plants might help fight against chronic stress has also been proposed in Western medicine for more than 50 years now. I. Brekhman, studied ginseng in 1950 extending the concept of adaptogens as: medicines that are similar to adaptogens but help in maintaining ideal homeostasis under stressful conditions. Later in 1969 new rules were formulated for plant-originated adaptogens stating that they must minimize harms caused by stressful conditions such as fatigue and depression, they must have a positive excitatory effect on the body, these excitatory effects should not cause side effects such as insomnia or excess energy consumption and finally, must not end up harming the human body. The definition for an adaptogen has been changing ever since and in 1998, the Food and Drug Administration of America defined adaptogen as a new kind of metabolic regulator that helps in environmental adaptation and prevents external harm. Adaptogens function mainly by affecting the hypothalamic-pituitary-adrenal (HPA). Yance, an American herbal doctor, proposed that adaptogens should be divided into three categories-primary, secondary and adaptogen companions. Primary adaptogens help in maintaining and restoring homeostasis, produce positive stress response and regulate energy use. Secondary adaptogens do not influence HPA axis directly but influence immune, nervous and endocrine systems. Adaptogen companions have beneficial effects on the HPA axis but do not formally belong to adaptogens unlike the other two types because they only interact with the other two adaptogen categories to improve their effect. Similar to how exercise works on the muscles so do adaptogens work on our adrenal glands. Initially when we exercise it causes stress on our body but as we continue to train and exercise our body becomes better at dealing with the stress and we don’t get as tired as before. Likewise, with adaptogens we are training the body to handle stress and its effects. We have a journal study elaborating on the effects of adaptogens on human health: Adrenal fatigue: Adrenal fatigue occurs when capacity of adrenals to secrete enough hormones to make necessary physiological and biochemical compensations for the stipulated stress levels doesn’t meet the requirements of continuous excess pressure. Stress hormone production increases as eternal pressure increases. Using adaptogens increases effectiveness of adrenal gland secretion reducing excess hormone production. Arthritis: Osteoarthritis and rheumatoid are the common forms of arthritis that are characterized by elevated pain and swelling. Adaptogens are noteworthy solutions for alleviating pain and inflammation. Sleep: Sleep has become a major problem with most people nowadays mainly due to presence of excess stress that affects the normal secretion of cortisol, the stress hormone. Sleep, exercise and diet are integral for sleep. Adaptogens help in producing the right amount of cortisol thereby relieving stress and enabling sleep. Neuroendocrine system: Adaptogens help in stabilizing internal environment of the human body by affecting the neuroendocrine system and also increase rates of oxygen, fats, protein and sugar utilization. Anti-tumor properties: Adaptogens inhibit cancer cell production and stabilization of the functions of human body. They also promote cell repair, prevent growth of tumors and pave way for cell-selective apoptosis. In cancer patients too, adaptogens help in improving their physical condition by modulating biological responses, remodeling immune mechanism and enhancing resistance of the human body. They also promote the production of marrow, increase the amount of blood cells, reduce infection, strengthen lethal effects of chemotherapy and radiation on cancer cells, inhibit tumor metastasis and development of multidrug resistance and also reduce stress hormone levels during immune dysfunction which is linked to tumor growth. Rhodiola rosea Extract (RRE) Roots and rhizome extract of Rhodiola rosea are adaptogens that act to increase the body’s resistance to stress, exhaustion and fatigue. It was long back in 1969 that USSR recommended using RRE for patients suffering from asthenia syndrome, neuroses, vascular dystonia, hypotension and schizophrenia. The affected individual was suggested to take 5-25 drops of the extract in a quarter glass of water thrice daily some 15-30 minutes before meals. Duration of therapy differed based on the individual anywhere between 10 days and 4 months. In another study, 128 patients between 17 and 55 years including both men and women were given RRE as a part of their treatment protocol after being diagnosed with fatigue. Results showed that these patients showed marked improvements in fatigue levels or they disappeared completely. Another open label study on 65 participants suffering from irritability, insomnia and somatic disorders showed improved effect on neuroses. Dispensing therapy with RRE in 177 patients with vascular hypotension showed that the extract helped to stabilize partially or completely 92% patients with hypotension. Another experiment that fed 58 patients suffering from stress-induced depression with 15 drops of extract thrice daily for up to a month or up to four months showed symptomatic improvement. Suffering from weakness or fatigue soon after getting up in the morning or hypersomnia both reduced greatly. There have been no potentially dangerous side effects of RRE observed and it seems to be pretty safe with no complaints of drug-drug interactions or others. Rarely, there have been cases of insomnia, headache, irritability and excitement reported. Tulsi & Ashwagandha There are a couple of studies that show that tulsi (Basil) has therapeutic properties such as adaptogenic, antimicrobial and anti-inflammatory. Basil is holy to Indians, is included as part of meals or even taken as supplements or used for preparing tea. It is said to enhance body’s natural response to deal with physical and emotional stress. But we also do have information against using basil in pregnant and lactating women due to unavailability of authentic data. The herb Ashwagandha gets its name from the odor it emits which is close to the smell of a horse. Its known as Indian Ginseng, Winter Cherry or even the royal herb in Eastern Medicine but there are not many human studies on this most commonly used herb that’s believed to empower the individual with strength and vitality similar to that found in horses, living up to its name! A study on this herb testing its safety and efficiency in reducing stress and anxiety in adults showed marked reduction in their stress and anxiety levels and also revealed no side effects. Other important herbs that do find their place as adaptogens include Eleutherococcus senticosus that’s used to treat chemotherapy-induced bone marrow suppression, angina, insomnia and poor appetite; Lepidium meyenii that’s claimed to increase strength, energy and stamina; Schisandra that’s used to decrease fatigue and stress and improve physical performance and reishi that’s believed to improve immunity. Incorporating Adaptogens in Real-time Cases While positive effects of adaptogens in stress-related changes have been observed in animal experiments there are a handful of drugs that have been adapted as adaptogens in today’s scenario. Though we do have studies and applications showing that plant-originated adaptogens are part of the elite herbal medicine helping mankind overcome stressors the clinical application of these plant-originated adaptogens and their use in healthcare products remains a mystery. We do have studies suggesting what affects our health right from helping us sleep better to stay energetic but we still are in a stage where we cannot 100% convey the message that adaptogens can have a significant impact on the body. But before adding them to our diet or as a supplement it is advisable to talk to the physician about it as one study found that common herbal supplements interact negatively with prescription medications and many times, patients don’t convey the names of all the supplements and pills they take before the doctor prescribes yet another one for their present illness. Still, we are not aware of the long-term effects of adaptogens. Individuals find it easier to pop a pill rather than take precautionary steps to avoid or overcome stress by practicing other stress-relief measures. It is not harmful to sip herbal teas and mix adaptogens with your soups or smoothies but when it comes to supplements ensure that they are safe as many supplement companies add plenty other things that’s been unheard of to improve both your strength and vitality. References A Preliminary Review of Studies on Adaptogens: https://www.ncbi.nlm.nih.gov/pmc/articles/PMC6240259/ Effects of Adaptogens on the Central Nervous System : https://www.ncbi.nlm.nih.gov/pmc/articles/PMC3991026/ Stress Management & the Role of Rhodiola Rosea: https://www.tandfonline.com/doi/full/10.1080/13651501.2017.1417442  Adolescence: Living at the Threshold between Restriction & the Liberty to Choose  The Image Aptly Portrays the Food Choices of Teenagers The Image Aptly Portrays the Food Choices of Teenagers Adolescence is an age where every teenager seems to be on a knife-edge and one cannot agree more on this point of view! It’s around puberty that girls and boys experience maximum growth with evident body changes happening in each of them. Besides physical growth, teens also evolve into mature individuals starting to form their own views and ideas. They start making judgements on our way of handling stuffs, comment on people’s appearance (fat or thin, beautiful and ugly and likewise), don’t extend an invitation to our advices and recommendations and feel like they have reached a stage where they are big enough to take decisions on their own. This decision-making idea has proved to be a costly affair in various domains of their life and one of them is certainly food habits. Many teenagers have brought about drastic changes to their lifestyles that include more unhealthy food choices, eating out frequently, absence of activity and late-night snacking all of which increase the adolescent’s nutritional risk over time. Having a teen in your household? I am sure you have been vigorously nodding your head to every sentence that’s written here!
Terrible Nutritional Choices Taken During the Vulnerable Stage of Life The period between 10 and 19 years of age is a vulnerable period where health-related behaviors that influence critical chronic degenerative diseases start and the food kids eat during this period are strong factors that determine their present and future health. Unfortunately, with the advent of processed foods and fast food restaurants, the diet quality of adolescents has sharply taken a dip and evidences too support this notion. There has been an increase in intake of energy-dense foods, aerated beverages and salty snacks while the consumption of fruits, veggies and whole grains has decreased paving way for obesity/overweight to be a major public health concern worldwide. Most of the teenager’s dietary choices are due to some distorted perception adopted by them. For instance, a study on adolescent girls found that these kids associated consumption of fast food with pleasure, independence and friends while consumption of healthy food was associated with parents and being at home. Environmental factors including family, friends and society have a strong influence on these children’s ideologies, weight gain and eating habits during their transition from adolescence to adulthood. Nurturing kids with disciplined eating patterns and activity schedules right from younger years is crucial for setting the stage for a healthier adolescence and adulthood. For this, parents should not only emphasize on the need to eat right but also lead the way being a role model for their child. Habits and behaviors form by adolescence and when dietary behaviors are formed these are established through adulthood staying for a lifetime. The prevalence of unhealthy lifestyle patterns hence increases the risk of chronic health diseases such as obesity that impede well-being. United States was the first country to popularize the fast food culture during the 1970s and now has become the largest fast food industry in the world. We have numerous reports on developed countries such as USA, UK and Australia that clearly emphasize the fact that adolescents in these places do not meet the required dietary guidelines as they display overconsumption of energy-dense foods and underconsumption of fruits and vegetables. But we have limited evidence on developing countries such as India and Africa. Still, existing research shows that adolescent’s food consumption varies according to gender and females, in general, display healthier dietary patterns than males. Australian girls consumed more fruits compared to boys while boys drank more carbonated beverages. Likewise, British girls preferred to eat more fruits and vegetables compared to boys while boys chose nutrient-poor foods comparatively. Researchers expect similar dietary habits from adolescents residing in developing countries as well and some of the studies are elaborated here. Food Consumption Pattern in Indian Adolescents A 15-page questionnaire with questions pertaining to meal consumption pattern, vegetarianism, food and beverage intake, snacking practices, home food environment, curriculum, consumerism, school canteen, acquisition of food skills and family characteristics was included in the dietary and lifestyle questionnaire (DALQ). The study included 356 boys and 670 girls who were between 14 and 15 years of age while most others were around 16 years of age. Nine food groups were chosen and with excluding water, among the other eight food groups energy-dense snacks was the commonly consumed food group. The other groups in descending order of food intake include cereals, energy-dense beverages, vegetables, fruits, milk and milk products, non-vegetarian food products and pulses and legumes. Adolescents generally consumed around 10.54 servings of water daily. Results It was observed that a majority of the adolescents did not consume food from all eight food groups, almost two-thirds (59%) did not consume pulses and legumes, more than 50% refrained from eating non-vegetarian items such as fish, meat and chicken, 45% did not eat fruits, 30% did not eat vegetables and 36% did not consume milk and milk products. Visible gender difference in the consumption of these 8 food groups were visible. While girls consumed more of veggies, fruits, cereals and non-vegetarian food products compared to boys it was also seen that male kids consumed more of milk and milk products and energy-dense beverages. Energy-dense snacks, pulses and legumes did not display evident differences in consumption portion between boys and girls. The present study is a clear evidence that more than 75% of adolescents consumed three or more servings of energy-dense snacks and 50% of participants consumed 3 or more servings of energy-dense beverages. While this study happened in Kolkata, another study in New Delhi showed that more than a quarter (32%) of secondary school kids consumed fast foods such as pizzas, burgers and fried foods three and more times every week. Despite being the largest producer of milk, the study showed that almost two-fifth of participants did not consume recommended dairy servings that nourish the body with energy, protein and micronutrients. Also, girls in the study ate healthier than boys reflecting the worldwide ideology that females ate healthier than males. This could be attributed to the weight-consciousness of the female population and also to the male population which often feels that eating greens, surviving on salads and healthy food was not a display of masculinity. A global survey on adolescents residing in Southeast Asian countries such as India, Indonesia, Myanmar, Thailand and Sri Lanka suggested that nearly 28% of participants reported consuming fruits less than once daily. Indian adolescents display unhealthy dietary patterns and until this trend changes we cannot expect to see remarkable changes in obesity/overweight rates in the Indian population. Food Patters of Saudi Arabian Adolescents A cross-sectional study was conducted on girls aged between 13 and 29 years and their body measurements were taken at the start of the study. Of the 196 participants involved in the study, 64.8% of them were adolescents aged between 13 and 18 years while the rest were adults. Results showed that more than 95% of them ate fast food at restaurants with 52.8% adolescent girls and 60.9% young adult girls consuming fast food once per week. 25.2% adolescent girls and 20.3% young adult girls consumed fast food twice or more per week. Common fast foods included beef or chicken burgers (70.4%), pizzas (32.7%) and French fries (29.6%). Most of the participants chose small or medium portion sizes and it was only 17.9% participants who went for large portion sizes. 89% adolescents and 75% adult girls consumed carbonated soft drinks along with their fast food meal while consumption of coffee, tea, sweetened fruit drinks and energy drinks were a rare combination with fast food. While adolescents mostly consumed fast food for taste, adult females consumed it for the sake of convenience. It was a surprising to find that a majority of these girls did not know the nutritional value of these fast foods or were totally ignorant of the concept of nutrition value. Cohort Study on Malaysian Adolescents The study on Malaysian students included 1361 adolescent girls and boys aged around 13 years. A 7-day dietary intake history regarding information on food and drink consumption at breakfast, mid-morning snack, lunch, tea, dinner and supper were noted by reputed dietitians. Height, weight and body mass index measurements were calculated at the start of the study. Among the total number of participants involved in the study 1290 of them completed a dietary interview. Of the lot, almost 65% were females. Study results showed that male adolescents consumed more energy (carbs, protein, fats and saturated fats), macronutrients and sugars compared to females. Females consumed more of vitamin D compared to their male counterparts but had inadequate consumption of iron. Both males and females had decreased intake of energy, vitamin D and calcium but showed optimal intake of proteins and fats. All these studies are a clear indication that adolescents anywhere around the world are not consuming a well-balanced meal that’s rich in nutrients. Most of the teenagers are inclined towards processed foods consumption quoting different reasons which also exists as the cause behind the obesity epidemic. Parents, teachers and the society must come together in helping children change their attitude towards food, help them choose more of vegetables, fruits and pulses to eat daily and make them realize the importance of a healthy diet in one’s life. References Food Consumption Patterns of Adolescents Aged 14-16 Years in Kolkata: https://nutritionj.biomedcentral.com/articles/10.1186/s12937-017-0272-3 Trends of Fast Food Consumption Among Adolescent & Young Adult Saudi Girls Living in Riyadh: https://www.ncbi.nlm.nih.gov/pmc/articles/PMC4366480/ Dietary Intake Among Adolescents in a Middle-income Country: https://journals.plos.org/plosone/article?id=10.1371/journal.pone.0155447  Effects of Sugar Consumption Cannot be Sugar-coated My kid loves to attend birthday parties and this is no surprise but being an introvert who doesn’t even open her mouth to ask for a glass of water to the host the fact that she runs to these get-togethers is amazing indeed. But this happiness of mine was short-lived once I realized that she loved eating the creamy cakes, greasy fries and drinking chilled soft-drinks (all of which are almost never present in my house) with no intention of even wishing the birthday kid! She is not an exception and there are many other kids with a similar state of mind living in this world amongst whom many of them are bad victims of obesity.
Obesity exists as a public health epidemic affecting both children and adults alike. Abdominal obesity has affected innumerable number of people as reducing tummy fat has become almost next-to-impossible for individuals. Fat is not our enemy and it is a macronutrient that’s very much needed by our body for proper functioning but we do have good and bad fat whose imbalance creates havoc in each of those whose dietary intake is not well-balanced. Such abdominal obesity is a major risk factor for metabolic diseases such as type 2 diabetes (T2DM), cardiovascular diseases (CVD) and non-alcoholic fatty liver disease (NAFLD). Fat accumulation can be visceral and subcutaneous and any type of fat accumulation is dangerous. But visceral fat causes more harm as it is the fat lining internal body organs. The higher risk for CVD and other diseases due to abdominal obesity is due to the accumulation of fat in non-adipose tissue. Such visceral adipose tissue (VAT) and hepatic triglyceride content (HTGC) are linked to metabolic risk factors including insulin resistance, coronary artery disease and cardiovascular disease. VAT releases free fatty acids (FFA) and cytokine secretion which together with insulin resistance result in fat accumulation in the liver and higher risk of T2DM and CVD. So, this makes both liver and visceral fats the main fat regions that need immediate intervention to prevent cardiometabolic disease in the form of physical activity and dietary changes. Studies show that dietary fibre, calcium and phytochemicals were inversely related to visceral fat deposits; following a healthy dietary intake and intake of medium-chain triacylglycerols show an inverse association with visceral fat and subcutaneous fat and studies show that increased energy intake during childhood years increases the risk of non-alcoholic fatty liver disease (NAFLD) irrespective of macronutrient intake. All these studies and other related ones focus on one single nutrient and its impact but it would be better to study the effects of food groups and foods together as foods might have multiple nutrients acting and interacting with each other brining in various effects. Though we know that fruits, vegetables and whole grains have a positive impact in reducing the risk of diseases and aid in weight maintenance/loss we don’t have much knowledge about the relationship between food groups and ectopic fat deposit. A group of researchers tried to understand the relationship between dietary intake of food groups and visceral and liver fat content in a population-based cohort. Netherlands Epidemiology of Obesity (NEO) Study The NEO is a prospective cohort study of 6671 individuals aged between 45 and 65 years with a self-reported BMI≥27 eligible for participation. All of them filled a questionnaire about demographic and clinical information and the next day visited the NEO study centre after an overnight fast. The study assessing relationship between food groups and fat content is a cross-sectional analysis of the baseline measurement of participants (who were chosen after imposing all exclusion criteria) with a measurement of VAT. Ethnicity was self-reported, tobacco smoking was categorized as current, former or never smoking; education level was self-reported; BMI calculation were made; menopause state was mentioned; basal metabolic rate was calculated based on age, sex, height and weight and participant’s frequency and duration of physical activity during leisure time was measured. A self-administered food frequency questionnaire (FFQ) helped the participants answer questions on the frequency (times per day, times per week, times per month or never) of food intakes during the past month. Serving size was estimated for calculating calories in terms of pieces of fruits, spoons of potatoes, etc. Nutrient intake and total energy were calculated using the Dutch Food Composition Table. Depending on nutrients, sources and biological effects foods were categorized into different food groups with the help of the FFQ. This included classifying them under dairy (milk, cheese, yogurt and butter), fruits and veggies, meat, sweet snacks (candy and cake), fish and plant-based fats and oils (margarine and oils). Calorie value of each food group was divided by the total calorie intake per day to find the total energy percentage. VAT and HTGC were measured in appropriate ways. Of the 6671 who were interested in the study only 2304 were included in the analysis due to various exclusion criteria including diabetes, elevated energy intake, incomplete FFQ, energy-restricted diet intake and unavailable data on smoking. The research team assessed the reproducibility of the dietary intakes of the food groups in 100 participants who completed the FFQ twice with only a 3-month gap between them. It was seen that after adjusting different factors dietary intake of fruits and vegetables was linked to 1.12 cm2 less VAT; intake of plant-based fats and oils was linked to 13.9 cm2 less VAT and dietary intake of fish, dairy, meat and sweet snacks was not linked with VAT. Introspecting on the food groups minutely showed that yogurt created a negative association between dairy and VAT in women whereas dietary intake of dairy, meat and fruits and vegetables was more strongly linked to VAT in postmenopausal women than in premenopausal women. Of 1715 participants with HTGC measurements dietary intake of sweet snacks was associated with a 1.19-fold higher HTGC while intake of fruits, dairy, vegetables, fish, meat and fats and oils were not linked to HTGC. Finetuning showed that vegetables were strongly associated with HTGC than fruits, and yogurt was linked with liver fat of all the dairy components. Sweet snacks and HTGC was linked strongly in premenopausal women than in postmenopausal women. The study shows that fish and meat are not associated with visceral fat, dairy was negatively associated with visceral fat and sweet snacks intake is linked to more visceral fat. Effect of Macronutrients on Liver Fat Content Hypercaloric Diet Most of the studies involve a hypercaloric diet where most of the participants are males with a BMI<27 who were overfed a fructose diet. Such consumption leads to increased fatty deposits in the liver. Men almost consumed >180 g/d of fructose compared to the recommended 30-50 g/d. fructose consumption is generally higher in the adolescent population. When studies tried to overfeed calories while reducing the quantity of fructose consumed there was no increase in fatty liver content even after 28 days. Fructose and glucose have similar effect on liver fat accumulation. We don’t consume fructose as an individual product but it is a by-product of fruits and of those containing free sugars (sugar-sweetened beverages or confectionaries). A study by Maersk et al compared the effects of ingesting 1L/d of a sugar-sweetened beverage, calorie-matched milk, non-nutritive beverage or water for 6 months. It was seen that consuming a sugar-sweetened beverage increased liver fat by 132-149% compared to other beverage groups but it must be noticed that as the different groups were having gender disparity and diets too were not standardized between the groups. Sevastianova et al. researched on a 3-week hypercaloric diet where 98% of excess calories was given in the form of added sugars such as candy, fruit juice and sugar-sweetened beverages. There was almost 27% increase in liver fat at the end of the high-sugar diet. A couple of studies showed that alongside increased total fat intake the fatty acid composition of a high-energy diet might also be an important regulator of lover fat accumulation. Bortolotti et al. showed that while increased fat intake elevated liver fat by 90% supplementing it with protein led to a reduction in liver fat accumulation compared to a high-fat diet. A protein-rich diet helped in moderating liver fat accumulation to a great extent. Excess consumption of fat and sugar led to increased fatty deposits in the liver. Hypocaloric Diet Various studies show that significant reduction in total calorie intake was linked to a significant reduction in liver fat content. This shows that weight loss interventions are standard or helpful strategies against NAFLD. A study by Browning et al. showed that reducing carbohydrate intake helped in reducing liver fat content than reducing total calories without changes to the macronutrient composition of the diet but some studies show that carbohydrate intake has little influence on change in liver fat content. But a large number of studies showed that total calorie deficits is the need of the hour for decreasing liver fat and alterations in macronutrient composition have little influence. Isocaloric Diet The difference in nutrient intake modulates liver fat content. Altering macronutrient composition to a higher fat intake leads to increase in liver fat content. This is applicable only to increase in SFA levels and increasing MUFA and PUFA levels reduce liver fat content. Consumption of a hypercaloric diet increases liver fat content, consumption of a hypocaloric diet decreases liver fat content and consumption of dietary sugars requires further clarity as the effect depends on the form in which they are consumed. Bottomline It has been proposed that obese/overweight children with fatty liver disease reduce fatty deposits in the liver by refraining from drinking soft drinks and fruit juices and cutting down consumption of sugary foods. Physicians advise patients with a fatty liver disease to cut down on excess sugar intake that’s generally high in processed foods and exercise regularly. Its tempting when you look at the glossy supermarket aisles stuffed with your favourite candies and treats. It is always advisable to stay away from the middle aisles that contain these stuffs. Avoid storing junk foods at home as these once again disturb the individual provoking him/her to eat them when its right before the eye. Staying on a healthy diet, avoiding excess consumption of processed foods and exercising regularly keeps you away from weight gain and fatty deposits anywhere in the body, especially the liver. References Sweet Snacks are Positively & Fruits & Vegetables are Negatively Associated with Visceral or Lover Fat Content in Middle-Aged Men & Women: https://academic.oup.com/jn/article/149/2/304/5290057 Influence of Dietary Macronutrients on Liver Fat Accumulation & Metabolism: https://jim.bmj.com/content/65/8/1102 To Avoid Fatty Liver, Avoid Sugary Foods & Drinks: https://www.nytimes.com/2019/01/22/well/eat/to-fight-fatty-liver-avoid-sugary-foods-and-drinks.html  Consume Ginger in Any Form to Find Relief from Vomiting & Nausea  Maternal Malnutrition Might Occur as a Result of Morning Sickness when Left Unresolved Maternal Malnutrition Might Occur as a Result of Morning Sickness when Left Unresolved Life is a cycle. Things branded as conventional and traditional are making a comeback these days in full swing. Bell bottom pants, tie-dye prints, puff sleeves, mini dresses from the 60s and maxi dresses from the 70s have captured the attention of fashionistas. In the food sector too while we gloat about superfoods and supplements more and more individuals are interested in knowing more about grandma recipes and authentic plant-based foods that ruled our country once. The present world boasts of organic foods, nutrient-packed foods such as kale and sea weeds and protein shakes that add energy to our body. Despite advancements the heath of this generation is only deteriorating at a faster pace. While youngsters in their 20s and 30s complain of knee pain our grandparents are hale and healthy even in their 70s and 80s. They were brought up in a processed food-free world where all the ingredients were pure, pesticide-free and healthy. They relied on millets, natural produce and above all toiled through the day to make ends meet unlike the present-day people who sit down in front of a computer and keep hitting the keyboard as fast as possible!
Ayurveda is deep-rooted in India and our ancestors relied on this treatment method for curing a number of ailments. Ginger, gooseberry, long pepper and garlic have been indispensable part of our culinary preparations since time immemorial. Do you remember the days when our complains on digestive problems and stomach pain had always been responded with simple yet effective recipes using ginger by our grandma? While it could have sounded funny back then but we still consumed it fearing our mom’s thrashings otherwise they have definitely helped up sail through tough seas quite a lot many times. Maybe now, medically too we are revisiting our traditional recipes for soothing certain ailments and finding relief from our age-old ingredients. With this, there is no denial in accepting the fact that ginger occupies one of the primary positions in all our homes. We might use it for preparing masala tea, as a spice in making sabjis, its juice is consumed to relieve digestive problems and we sometimes eat small chunks of ginger with jaggery to avoid vomiting. Overeating can sometimes lead to a persistent vomiting sensation that’s otherwise not much of a problem. But vomiting and nausea remain critical factors affecting quality of life in most pregnant women in the form of morning sickness. Ginger, a traditional form of medicine has once again occupied mainstream position in relieving nausea and vomiting symptoms in pregnant women. Traditional & Complementary Medicines (T&CM) The World Health Organization feels that T&CM have come a great way from their origin. The side effects of common medicines and the antibiotic resistance that’s increasing seen these days are evidence enough to make a switch to other forms. Ginger, a herb popular for its culinary and medicinal value has been used in Asian and Ayurvedic medicines as an anti-inflammatory and anti-pyretic agent to treat diabetes, rheumatism, nausea, diarrhoea, stomach pain, UTI, rheumatism and to strengthen memory as well since thousands of years. Though a native of Asia it is now cultivated all around the world making it an indispensable cooking ingredient and a household cure for flatulence. While Indians love this rhizome, even Chinese and Japanese individuals have used it to treat headaches, cold, nausea and stomach problems. Pregnant Chinese women have been consuming ginger to combat morning sickness. Nausea and vomiting are common complaints during the early stages of pregnancy and there are even some theories which support that these symptoms convey the fact that the fetus is healthy and growing normally. Nausea and vomiting of pregnancy (NVP) occur in 80-90% of pregnant women and is known as morning sickness (while it can occur anytime of the day its effects are maximum soon after getting up in most women). It starts by 4-9 weeks of gestation maximizing by 7-12 weeks and subsiding by week 16. Very rarely, some women experience its symptoms (mostly nausea and vomiting, some have nausea without vomiting but vomiting without nausea is a rarity) until delivery. 1-2% women experience a debilitating condition known as ‘Hyperemesis gravidarum’ where nausea and vomiting symptoms are extremely severe that it can lead to starvation and dehydration. Despite these effects the exact cause behind NVP remains a mystery till date. Fighting NVP While we do have traditional medicines to limit NVP many pregnant women prefer not to use them fearing harmful side-effects. While we might argue that NVP is a part and parcel of every pregnancy some women suffer badly from malnourishment, weight loss and a completely undesirable pregnancy phase. Still pharmacological drugs don’t find a place in their kitty and non-pharmacological treatment options are mostly preferred by pregnant women and one such option includes using ginger to treat NVP. Ginger is included in the US Food and Drug Administration’s ‘generally recognised as safe’ list, it is included in the pharmacopoeias of Western countries, the ‘British Herbal Compendium’ lists ginger as a remedy for vomiting with pregnancy and UK has been using ginger capsules as a remedy for motion sickness for more than 40 years. Still, scientific evidence is mixed for using ginger against NVP as higher doses of concentrated ginger in powder form or herbal tinctures increases bleeding risk by decreasing platelet aggregation and also elevates stomach acid production. Below is a systematic review (SR) of the available studies that look into ginger and its effectiveness against NVP. Systematic Review of Ginger as an Aid Against NVP The review included randomized control trials (RCT) where women suffered from NVP. Comparisons were made among women who consumed any form of ginger (fresh root, dried root, powder, tablets, capsules, liquid extract and tea) orally to those on placebo or active ingredient. Databases were searched and the trials were chosen according to the study criteria. Only 12 studies met the study criteria which included a total of 1278 participants. While 11 of the 12 studies included women suffering from NVP only one study included women suffering from HG. Almost all the studies used ginger powder capsules as intervention anywhere between 1000mg and 1950 mg ginger per day. 1 study included ginger biscuits as intervention amounting to 2500 mg ginger per day. One study used ginger syrup, another used ginger extract and yet another used ginger essence. 7 studies used a placebo as control: 2 studies used lactose as placebo, one used lemon oil, one used flour and one used soya bean oil. One study used placebo biscuit and yet another one capsules. Ginger Versus Placebo Seven studies analysed the effect of ginger versus placebo and reported the following results:
Only 3 of 12 studies reported on this. 1 study reported that ginger did not improve response compared to placebo. Adverse Effects & Side Effects Four studies reported no adverse effects of ginger, one study reported that the patient suffered spontaneous abortion while yet another patient sought legal abortion. For any event such as diarrhoea, drowsiness, headache, heartburn, spontaneous abortions and abdominal discomfort that called for medical treatment there was difference seen between the ginger and placebo treatment group. Reduction in Vomiting Frequency 4 studies reported reduction in vomiting episodes but there was no difference in results seen between doses. The reviews do seem to suggest benefits of ginger in minimizing symptoms of nausea in pregnancy but did not have much effect on vomiting episodes. Other Studies Willets et al. conducted a randomized double-blinded placebo-controlled study that looked into the effect of ginger extract on morning sickness symptoms in 120 pregnant women. Four days later it was seen that nausea experience score was less than zero but vomiting symptoms were not affected between the ginger-consuming group and the placebo group. Keating et al. showed that 1 g of ginger syrup consumed for two weeks helped 67% women in the ginger group to stop vomiting at day 6 vs 20% in the placebo group. Basirat et al. did a randomized double-blind clinical trial on 62 pregnant women of which 32 women took 5 biscuits daily for 4 days each containing .5 g of ginger. Nausea scores improved in this group compared to placebo but vomiting showed no changes. But 4 days after treatment the number of women who had no vomiting in the ginger group was greater than that in the placebo group. Ding et al. pointed out that the various ginger treatment methods were safe and effective for treating NVP. Two other meta-analyses supported the fact that ginger could be a safe and reliable way to curb nausea and vomiting in pregnant women. Ginger, a herb that’s been in use for centuries is considered to be safe and effective against nausea and vomiting in pregnant women when used within recommended doses for a stipulated period of time. References A Systematic Review & Meta-analysis of the Effect And Safety of Ginger in the Treatment of Pregnancy-associated Nausea and Vomiting: https://nutritionj.biomedcentral.com/articles/10.1186/1475-2891-13-20 How Safe is Ginger Rhizome for Decreasing Nausea and Vomiting in Women during Early Pregnancy? https://www.ncbi.nlm.nih.gov/pmc/articles/PMC5920415/ Medicinal Value of Ginger with Focus on its Use in Nausea & Vomiting of Pregnancy: https://www.tandfonline.com/doi/full/10.1080/10942910601045297  Ageing with a Healthy Heart is the Best Way to Celebrate Retirement  Imbalanced Sodium & Potassium Levels Increase the Risk of Hypertension Imbalanced Sodium & Potassium Levels Increase the Risk of Hypertension Twins might be identical or non-identical in appearance but their behaviour and characteristics have always been non-identical. Among nutrients too, it is not wrong if we call Sodium and Potassium as twins owing due to the strong relationship between them. These two together play a huge role in regulating blood pressure and are closely involved in bone health. Both of them are electrolytes needed for normal body functioning, fluid balance and blood volume maintenance in our body. The very question now is how much of these nutrients are needed for a balanced life?
Molecular pumps pull potassium into cells and push sodium out of them to create a chemical battery that drives the transmission of signals along the nerves thereby empowering muscle contraction. An imbalance in sodium-potassium levels lays the foundation for a number of health problems-too much of sodium content and too little of potassium can raise blood pressure levels but such imbalances have become problematic recently. Long long ago, when man roamed the Earth in search of food he consumed more of fruits, vegetables, leaves, flowers, roots and plant sources (our so-called Palaeolithic diet) which provided humans with abundant potassium and minimal sodium. But now, sodium consumption has gone way above normal limits with the inclusion of processed foods and high-salt meals in our diet whereas potassium levels are far below recommended values due to minimal consumption of produce and other plant-based foods. The body tries to maintain sodium-potassium balance with what we feed to it. Higher sodium levels and lower potassium levels worsens health as the body tries to hang on to the available nutrient, sodium, to compensate for the missing nutrient, potassium. This complicates the situation even more as blood pressure shoots up and the heart muscles are forced to work harder. Its possible to throw out sodium by bringing in more potassium into our system and this proves to be extremely useful in helping the heart and arteries as well. Its sad that the relationship between sodium and potassium and vascular function has not been brought into the limelight as required. Arterial Stiffness Cardiovascular disease is widespread in our world today owing to different reasons. Increased arterial stiffness and wave reflection are independent risk factors that increase the risk of cardiovascular events. Studies show that meals high in sodium content increase augmentation index in normotensive adults and such prolonged intake (more than 2 weeks) in young, healthy males with normal BP increase wave reflection and carotid BP. Thereafter, sodium restriction for the next two weeks improved carotid arterial compliance and augmentation index in elderly people with systolic blood pressure. But potassium’s effect on vascular function has not been explored much, even in those research studies that have dealt with it have inconclusive effects seen and some showed no change in arterial stiffness as well. Multiple trials have given hints that high urinary excretion ratio affects BP levels and cardiovascular disease risk which makes researchers even more interested in knowing the link between sodium and potassium interaction. Effect of Sodium & Potassium Interaction on Arterial Stiffness One study specialized in understanding this link between sodium and potassium and their effect on arterial stiffness. The study included 36 participants who were healthy and young aged around 24 years. Those who were obese, smoking, under medications for cardiovascular/hypertension, with history of hypertension, cardiovascular disease, diabetes or renal impairment were disallowed from participating. All the participants were given instructions on the recommended portion sizes and asked to eat as they would normally and include two weekdays and either of the weekend days in the record provided by the research team for noting down eating schedules. Urine samples were collected for calculating free water clearance and fractional excretion of sodium, potassium and chloride. Physical activity levels of each of the participants were tracked and the measurements were noted down. All the participants were informed not to exercise for 24 hours, eat for 4 hours and drink alcohol/caffeine for 12 hours prior to testing. Radial artery waveform was recorded using a applanation tonometry with the help of high-fidelity strain-gauge transducers placed over the radial artery. Central pressures and augmentation index (AI) were obtained from the synthesized wave. AI indicates wave reflection and is influenced by arterial stiffness. Reflection magnitude (RM) was calculated as the ratio of the amplitudes of reflected/forward waves. Carotid-artery pulse wave velocity (PWV) was calculated using tonometry to record carotid artery and femoral artery waveforms simultaneously. Blood samples were taken from all the participants to measure plasma haemoglobin levels. Results All participants had normal BMI ranges, normal iron status and electrolyte levels. Physical activity assessment showed that all the participants expended 1025±279 kcal/day above resting energy expenditure. Average BP measurements were 117±2/63±1 mm Hg. All the subjects consumed around 2200 kcal/day where carbs provided 50% of the energy requirements, 31% were from fats and 18% was from proteins. Women consumed comparatively lower calorie numbers. Sodium intake was around 3763 mg/day which is well above the recommended levels while men consumed more than women. Potassium intake was around 2876 mg/day which is well below the recommended 4700 mg/day but there was no difference between both the genders in terms of potassium consumption. Sodium and potassium intake matched urinary excretion data suggesting that excretion reflects dietary intake. Sodium to potassium ratio was 1.4±0.1 and this is well above recommended numbers of 0.49. Average AI was 2.2% and PWV was 5.2 m/s with females having higher AI rates than males. Though no correlation was found between sodium excretion and AI a significant inverse correlation was found between potassium excretion and AI. There was a significant relationship between sodium/potassium excretion ratio and AI, Tr was linked to potassium excretion and those with decreased potassium intake exhibited shorter time delay of the reflected wave. The link between potassium excretion and PWV showed that those with greater potassium intake have a slower velocity but there were no similar results seen between sodium/potassium excretion ratio and PWV. RM, the ratio of reflected and forward waves was significantly linked with sodium/potassium excretion ratio but not either of the two confirming that both sodium and potassium intake might be important mediators of wave reflection. The study clearly indicates that potassium imposes greater influence on wave reflection in healthy, young adults- lower potassium excretion was linked to greater wave reflection and pulse wave velocity was faster. The China Salt Substitute study compared the effects of a potassium substitute containing 25% potassium chloride to regulate salt levels in individuals with higher risk factor for vascular disease over a 12-month period. Though this substitute incurred time delay in wave reflection there was no changes in AI. Another study by Matthesan et al. probed into the impact of supplementation of 100 mmol potassium chloride daily for 28 days. All the participants had a standard diet consisting of 150 or 200 mmol of sodium depending on energy needs. Results showed a small but significant increase in PWV without changes in AI or BP in the study participants. Other studies looking into potassium effect on wave reflection found that decreased supplementation of potassium did not create much of a difference in results. In our present study, high potassium levels were fed and these were associated with lower AI and a slower PWV. Arterial stiffness plays a significant role in the relationship observed between potassium excretion and wave reflection by encouraging the speed up of reflected wave. There is an inverse relationship between potassium intake, wave reflection and arterial stiffness in young, healthy adults. Increasing potassium levels in the diet helps in reducing the risk of cardiovascular disease besides lowering blood pressure levels. References Lower Potassium Intake is Associated with Increased Wave Reflection in Young Healthy Adults: https://nutritionj.biomedcentral.com/articles/10.1186/1475-2891-13-39 Potassium and Sodium Out of Balance: https://www.health.harvard.edu/staying-healthy/potassium_and_sodium_out_of_balance  Learn to Escape from the Temptation Trap  Healthy-weight People are Less Tempted Towards High-calorie Foods Healthy-weight People are Less Tempted Towards High-calorie Foods It’s the time of the year when we are in a festive mood as Christmas and New Year are very near. We are looking into various party options, the best DJ’s who can make our New Year Eve awesome and the best cuisines that could be a treat to our taste buds. Besides these, plans for Christmas meet ups and cake exchange roundups are happening in full swing. Among all this buzz, are you one of the very few who stands grounded resisting all these temptations but enjoys the buffet spread and the food varieties sticking to optimal portion sizes? If yes, it should be highly appreciated as most of us are not wired that way. The sight of a yummy doughnut or a lip-smacking burger dissolves all our resistance to eat healthy food and our mind never becomes satisfied until we eat it. Moreover, New Year is the time of the year where we make commitments to ourselves to become better taking up goals and resolutions that once again disappear into thin air in course of a month or two. Obesity and overweight, two of the most debilitating conditions affecting our health has become a global concern owing to their extreme side effects on the quality of life of individuals. They pave way for serious health problems including cardiovascular diseases, cancers and other conditions as well. Calories consumed is more than calories burned resulting in an energy imbalance that is the root cause for excess fat accumulation in the body.
The primary deal now is to identify the underlying mechanisms that trigger such excessive energy intake in order to control the obesity epidemic. We do have a number of research studies probing into the genetic, hormonal and metabolic reasons associated to dietary intake and weight gain. Mankind has strong ties with his previous generations carrying on their genetic traits but the surrounding environment also has equal influence on his/her actions. We safely blame our genes for any negative consequences of our action, for our slow metabolism or even our laziness leaving behind all the efforts that could have helped us overcome these negative effects in life. So, indeed the fact that number of studies helping us understand the underlying and modifiable neural mechanisms that motivate the decisions about ‘what’ and ‘how much’ are fewer in number comes as no surprise to us. Drug and alcohols were some of the common addictions decades back but mankind slowly started digging his own grave by becoming addicted to smartphones, tablets and games. Gaming addiction has been declared as an official addiction by the World Health Organization. Food has been the first love for many who are ready to give up several things for it. These guys can never resist the temptation of highly palatable, calorie-rich foods that’s now been designated as an addictive behavior that’s similar to other addictions. An analysis on those who eat excessive portions reveal that they blindly select their favorite foods thinking about the short-term happiness totally turning a blind eye to the long-term consequences staying put in a situation where they have lost the ability to make optimal food-related choices. Researchers feel that three key neural systems that include the following might provide explanation for the inability to control temptation of food and the development of less-healthful eating habits:
Study on the Neural Systems Triggering the Temptation to Eat Tasty Food The study included 30 young healthy adolescents (17 of them were females) aged around 19.7 years whose average BMI was 23.1. None of them were under treatment for obesity and the research team ensured to exclude those who were suffering from neuropsychiatric disorders, medications or issues such as anxiety, bipolar disorder, psychoses or substance abuse that could affect neuroimaging results with the help of a technique called SCID. All the participants were asked to answer a 41-item questionnaire that probed into the participant’s history of diabetes, hypertension, lungs, heart, kidney or liver disease. Questions on head trauma, neurological diseases, use of any medications, smoking, alcohol use and caffeine consumption were present in the same questionnaire. Participants with positive answers to a history of head injury, treatment for obesity or neurological disease were excluded from the study. All the participants were requested to come for completion of their behavioural task and scan. They were asked to refrain from any intense physical activity 24 hours prior to the scan but there was no restriction in meal and food habits. Height and weight measurements were taken before the scan, 1 24-hour dietary recall was done and the participants rated their hunger level from a scale of 1 (not hungry) to 10 (extremely hungry) to ensure that none of them were in a deprived state. Those who had a score >5 were asked to return back some other time after eating a normal meal. All the participants performed two food-specific go/nogo taks: one low-calorie food go and high-calorie food nogo task (LGo task) and the second, a high-calorie food go and low-calorie food nogo task (HGo task). Cucumbers, celery, broccoli and carrots were some of the foods included in the low-calorie food images while high-calorie food images included cookies, ice creams, potato chips and cookies. Each of them were asked to press a button when they were ready to go to trial and withhold responses to the nogo trials. There were 120 go trials (75%) and 40 nogo trials (25%) occurring in a random order such that Nogo trials also has equal probability as the Go trials also ensuring that no two Nogo trials appeared consecutively. Every image was present for 500ms and every task had a maximum duration of 8 minutes. Results The participants exhibited normal intelligence (IQ) and working memory/functioning. Each of the individuals reported consuming 2.4±1.6 servings/day/1000 kcal of low-calorie foods (fruits and vegetables) and 1.8±1.3 servings/day/1000 kcal of high-calorie foods (such as sugar-sweetened and fatty foods). It was good to realize that all of them consumed more servings of low-calorie foods comparatively irrespective of age and hunger rating. But there was a gender difference reported with females consuming more low-calorie foods than high-calorie foods in comparison to males. Participants made frequent errors and faced hard times inhibiting responses to high-calorie food cues in the LGo task and reaction time was also longer in this task. Participants were willing to press the button more willingly when they were presented with high-calorie food images in the HGo task. Reaction time for the trials in the HGo task was negatively correlated with BMI and high-calorie food consumption indicating that people with higher BMI values responded more readily to high-calorie foods. It was also observed that inhibiting response to high-calorie foods was difficult for individuals with higher BMI and those who consumed more of high-calorie foods. The neural system showed more activation during nogo trials than go trials. The task imposed effect on regions of the brain including bilateral frontal pole, bilateral dorsolateral prefrontal cortex (DLPFC) and ACC which were more active during the nogo trials than during go trials. The left occipital pole showed main effect of the stimuli activacted every time when a high-calorie food picture was shown in comparison to viewing a low-calorie picture. There was no interaction seen between task and stimuli in any region of the brain. Activation in the anterior cingulate cortex (ACC) comparing nogo trials to go trials was negatively correlated with BMI and high-calorie food consumption. Also, females displayed more activation in ACC than males when comparing nogo trials to go trials. Go trial results showed that high-calorie food cues were linked to higher activity in the right striatum relative to low-calorie food cues. Such increased activity in the right striatum was linked to both BMI and level of high-calorie food consumption. Males and females did not show any difference in the activation of the right striatum. The study did show the neural basis that exists as a reason behind one’s loss of ability for self-control when shown tempting food choices and this could be used to bring about intervention strategies to reduce the consumption of high-calorie foods. This in turn reduces the rates of obesity/overweight that’s disrupting the health of people in the society. Pre-exposure of Tempting Food Decreases Temptations Pre-exposure of tempting food in situations that discouraged temptations improved resistance to food temptation thereon. This has been tested in normal-weight people and has shown beneficial results but we don’t have studies until now testing it on obese individuals. It is seen generally that obese people respond differently to tempting food compared to healthy-weight people-they are poor at resisting temptations and value such tempting rewards more. We have a study that took up pre-exposure of tempting food to obese people and its effect on preventing them from succumbing to temptations in due course. The study happened in two different university labs, Greece and Belgium, which included 115 individuals of whom 77 were healthy-wight and 38 were obese participants. All the participants were inquired about their hunger levels (on a 7-point scale) and were informed of their participation in a word fluency test. Each of them was randomly assigned to a candy scrabble game (pre-exposure condition, PE) or a foam scrabble game (control condition, CTR). Each group received 30 letters which was used to form words during the game. Then, each of them received two bowls of the same volume of a tempting snack and the samples were named as A and B though in reality both the bowls contained the same snack. Each of them either received two bowls of peanut M&M’s or two bowls of Maltesers. Each of the participants were asked questions such as ‘How crunchy are these chocolate candies/crunchy nuts?’ ,’to what extent do they melt in the mouth’, etc. Results Difference in the sample with respect to age and gender was observed with no difference in the average BMI. No difference in hunger levels was observed between the healthy and obese participants and within the obese group no difference in hunger levels was observed for CRT and PE condition. In the PE condition hunger levels were higher than in the CRT condition for obese participants while the healthy-wight participants ate less. In health-weight participants, those who performed the scrabble test with candy letters (PE) ate significantly less during the subsequent taste test than the group that performed the task with foam letters. Obese-weight participants in both the groups consumed a similar number of tempting snacks. In the control group, the obese-weight participants ate less than the healthy-weight participants but the same did not happen in the experimental group. The study showed that pre-exposure helped healthy-weight participants to consume less but the same was not observed in obese individuals. References Poor Ability to Resist Tempting Calorie Rich Food is Linked to Altered Balance between Neural Systems Involved in Urge & Self Control: https://nutritionj.biomedcentral.com/articles/10.1186/1475-2891-13-92 Pre-exposure to Tempting Food Reduces Subsequent Snack Consumption in Healthy-weight but not in Obese-weight Individuals: https://www.frontiersin.org/articles/10.3389/fpsyg.2018.00685/full  Are You Causing Self-destruction to Knee Joints by Running? Weighing above normal weight ranges and wishing to try running or Zumba? Not many recommend doing these as they fear applying increased stress on the knee might disturb it contributing towards joint pain and more. Overweight/obese people are generally recommended to pursue walking as the primary exercise form to reduce a certain amount of weight before moving on to other more intense ones such as jogging, running, playing a sport and likewise. But there are many controversies surrounding the fact whether running is harmful to the knee, especially if it would induce osteoarthritis.
Osteoarthritis (OA) is the common form of arthritis that exists as a leading cause of disability, especially in the elderly population and those participating in sports activity. Knee osteoarthritis (KOA) is one of the primary causes of long-term disability in the world that can result in chronic pain, limit activity level and decrease quality of life of the affected individual. Age, obesity and genetic factors are the primary risk factors for KOA which can be greatly eliminated by performing regular physical activity. But sadly, not even a quarter of the world population meet the recommended guidelines of performing 150 minutes of moderate-intensity activity per week. Not many individuals take up exercise as a serious means to fight knee osteoarthritis and it becomes the physician’s burden to deliver the required exercise performance from the patient. Walking is the best preferred option by physicians but running exists as one of the popular activity forms among individuals as it bestows numerous psychological and physical benefits on the individual. But running has always remained as an activity form that has been negatively associated with knee joint health (since the knee exists as one of the frequently used body parts in runners). Chronic mechanical overloading can damage structures within the knee. But there are also opinions that runners generally have a lower body mass index compared to non-runners that could protect them against knee osteoarthritis. We have data supporting and opposing the effect of running as an exercise: AlentornGeli et al. related recreational running with lower rates of KOA while competitive running was linked to higher rates. Though research on this topic is growing day by day the absence of precise knowledge on the understanding between KOA and running is absent until now. We also have data showing that long-distance running might be linked to progression of knee OA in the absence of knee injury, obesity or poor muscle tone. OA results in higher disability rates leading to increased rates of hip and knee replacements. Running, an exercise form, that exists as the favourite among millions of individuals is now at the junction of also existing as one of the causes of knee osteoarthritis. Even an elevation in BMI causes a raise in the risk of OA. Studies that Support or Reject Running as a Risk Factor for OA A longitudinal study on long-distance runners and controls suggest that disability levels in runners increase with age at 25% of the rate of more sedentary controls. When the study was designed in 1984 there were serious concerns that running could accelerate OA due to repetitive trauma to the joints. The study is a long-term one conducted for a period of 18 years with a hypothesis that long-distance runners were prone to more severe OA than aged populations. The study included long-distance runners aged ≥50 years who had been into running for more than a decade. The control group was selected from a random sample thereby assembling a cohort of 538 runners and 423 controls who met the eligibility criteria. Weight-bearing radiographs of the knee was taken in 1984, 86, 89, 93, 96 and 2002. During the 18 years of study, radiographs of the knee was taken for both runners and the control group. After a series of eliminations and due to unfavourable reasons only 113 participants remained in the radiographic study and of them, 98 (45 runners and 53 controls) had at least two sets of radiographs. All participants provided information on demographics, medical history, BMI, exercise routines, injuries and functional status. The total time spent on performing vigorous-intensity exercises such as running, swimming, brisk walking and aerobic dance was noted down. Participants in the intervention group were slightly younger, had a lower BMI and reported a greater prevalence of knee injury than the controls. They had also decreased their running time by 55% at the end of the follow-up period but maintained overall time spent in vigorous-intensity exercise (almost 300 minutes/week). In the control group, a small proportion of them were involved in running as an exercise form and all the controls increased their overall time spent in vigorous activities by 100 minutes/week and this was mostly brisk walking. There was a significant difference in the time spent in running between the intervention and control group throughout the study. Results Most of the participants showed little OA at the start and end of final radiographs. Though total knee scores were worse in runners at baseline compared to controls the scores of both the groups at the end of the study remained the same. Joint space width (JSW) of the worst knee was worse among runners than controls at the initial radiograph but was nearly identical at the final assessment. While two participants in the control group had undergone knee replacement there were none in the runner group with such need for replacements. Three controls had a JSW of 0, one participant in the runners group had a JSW of 0 and only 10 participants (6 controls and 4 runners) had JSW in the worst knee ≤1 mm. Total knee score (TKS) remained low for all participants at the final radiographs. The mean TKS was 3.6 for runners and 4.2 for controls while the possible scores can be between 0 and 36. The study result is consistent with some other long-distance running study results that show that running may not be an independent risk factor for knee OA. But we also have a number of studies that show that participation in specific sports at the elite level does increase the risk of knee OA. This study is an example for the fact that long-distance running should not be discouraged among healthy older adults fearing progression of knee OA. Osteoarthritis Initiative (OAI) In the OAI there were more than 2000 participants who completed a survey of exposure to leisure-time physical activities and the study dealing with the effect of running on KOA is a cross-sectional study nested within the OAI in men and women aged between 45 and 79 years who showed no symptoms of OA nor had high risks for the same; or were at a high risk for developing OA or already had knee OA. All the participants were asked to complete a questionnaire which probed into 37 leisure-time physical activities that included jogging or running. All the participants were asked to identify activities that they performed for at least 20 minutes in a day at least 10 times in their lives during the age periods of: 12-18, 19-34, 35-49 and ≥50 years old. 3 most frequently performed activities by each of the participants were identified during those age periods and information regarding them were recorded. Those individuals who mentioned running or jogging among the top 3 activity list were defined as runners in that specific age period. At the 48-month visit the participants were asked to report on any knee-specific pain or stiffness. BMI, height, weight and reports on any knee injuries were reported at baseline and during annual visits. After database search, elimination and selection the study included 2,637 participants of which 55.8% were females, 634 of them were from the progression cohort (had symptomatic OA at baseline), 1,899 were from the incidence cohort (did not have symptomatic OA but had high risk of developing the same during follow-up) and 104 were from the nonexposed control group. 778 of the participants had been engaged with running at some point in life but only 2-5% ran competitively. Results showed that any history of running was associated with less frequent knee pain, had lower odds of radiographic and symptomatic OA compared to those who never ran in the unadjusted model but when adjusted for BMI, height, weight, sex and leisure-time physical activity that significantly correlated with running during the relevant time frame there was no significant difference found. There was no link found between running and either injury or BMI in any of the 3 outcomes. Studies show that injuries can occur in 7-50% of runners and because of this, runners are expected to be at a high risk for knee OA but there was no such risk found in the present study. The researchers attribute this to the lower BMI seen in runners compared to non-runners. This study shows that running does not cause harm to the knee in any way and those with lowest BMIs were involved in running as a major activity form in their lives. Perception of Individuals & Physicians about Running and Knee Health in Canada A cross-sectional survey was conducted in the Canadian population and once individuals agreed to participate, the respondents placed themselves in one of the five subgroups based on their profiles: non-runners without KOA (NRUN), non-runners who have received a diagnosis of KOA (NRUN-OA), runners without KOA (RUN), runners who have received a diagnosis of KOA (RUN-OA) and healthcare professionals (HCP) from different backgrounds. All the participants were asked to fill questionnaires that contained a series of questions pertaining to the study. A total of 114 non-runners, 388 runners and 329 HCP completed the survey. Results showed that 13.1% of public respondents perceived running as an activity that hurt the knee and 25.9% of them were uncertain of the effect. A great number of participants belonging to the NRUN and NRUN-OA group had a negative perception compared to the RUN group, 8.2% of the HCP felt that regular running was bad for knee joint health but 78.1% of them disagreed on this point. There was a negative perception felt by 3.9% of HCP who ran and 15.2% of HCP who did not run. Only 7.6% of the public felt running to be an activity that leads to KOA but 33.9% of them were unsure about it. Only 2.7% of the RUN population felt running to be detrimental to knee health compared to 23.1% of NRUN and 24.2% of NRUN-OA population. 15.5% of the public felt that running marathons or long-distances would end up in KOA while 43.6% of them were uncertain of the results. But 47.9% of the RUN, 15.4% in NRUN and 19.4% in NRUN-OA disagreed with this result. On the whole, 17.9% of the public felt that running with KOA would lead to profound knee damage, 48.4% were uncertain and 32.7% of the NRUN population and 46.8% of the NRUN-OA population agreed with this statement than the run subgroup. 41.9% public felt that running with KOA was ok on days when there were no symptoms felt but 39.5% were uncertain about it. But it was 12.4% of the general public who felt that running with KOA was a means to accelerate the need for a total knee arthroplasty but more than 50% of the public were confused regarding their stand in this. 30.8% of NRUN and 37.1% of the NRUN-OA population agreed compared to 5.4% of the run population. The study shows the clear confusion existing among individuals with regards to running and its effect on KOA. All these studies show that evidences are still inconclusive and the risk of developing OA has to be identified individually presently. There is no way in which we can conclude on the role of running in knee OA with these results. References Long-distance Running & Knee Osteoarthritis A Prospective Study: /https://www.ncbi.nlm.nih.gov/pmc/articles/PMC2556152/ Is There an Association between a History of Running and Symptomatic Knee Osteoarthritis? https://onlinelibrary.wiley.com/doi/full/10.1002/acr.22939 What are the Perceptions about Running and Knee Joint Health among the Public & Healthcare Practitioners in Canada? https://journals.plos.org/plosone/article?id=10.1371/journal.pone.0204872  Oh My! Fat Accumulation Has Happened in My Internal Organs as Well! Liver, an important organ in the human body, is not much talked about despite its versatility in fighting against infections, aiding in digestion, storing energy and cleaning the blood. This organ residing in each of us contains a designated amount of fat which is normal but the problem arises when more than 5-10% of the liver’s weight is fat resulting in what is termed as a fatty liver. Non-alcoholic fatty liver disease (NAFLD) is the build-up of excess fat in the liver cells that’s not a result of alcohol commonly seen in overweight or obese people. NAFLD can be split into four stages that includes simple fatty liver (steatosis), non-alcoholic steatohepatitis (NASH), fibrosis and cirrhosis (here, the individual is at risk for hepatocellular carcinoma (HCC)). Many people get into the first stage even before realising what’s happening but it can take years together to reach the 3rd or 4th stage before which significant lifestyle changes can prevent this condition from worsening. Otherwise, such high fat accumulation in the liver paves way for other serious health conditions such as diabetes (this once again increases the risk of heart disease), high BP and kidney disease.
Prevalent rates of the disease are different in different parts of the world with maximum prevalence of 20-30% recorded in Western countries. Earlier days saw the need for humans to hunt or gather food for fulfilling nutrient requirements and this included energy expenditure to replenish the lost energy with food. But now, despite the prevalence of malnutrition and poverty among a class of people there are a majority of individuals who are provided with a surplus of daily calories thereby increasing the rates of obesity and overweight worldwide. This kind of an obesity epidemic has made it possible for diseases such as NAFLD to become diagnosis of chronic liver disease. Though it can affect any individual of any age it is generally the middle-age people who are affected. Though there are different treatment plans proposed for NAFLD weight loss and lifestyle management exist as the most reliable forms of treatment plans till date. We have research supporting the fact that lifestyle interventions reduce markers of liver lipid and metabolic control along with reducing intrahepatic lipid (IHL) and studies even show that increased exercise practices are linked to lower levels of IHL but it is also essential to remember that weight loss is difficult to achieve and even more difficult to maintain. Even The American Gastroenterological Association, the American Association for the Study of Liver Diseases, and American College of Gastroenterology all of them recommend physical activity as one of the best treatment methods for NAFLD. Given below is a detailed study of hbow exercise affects NAFLD. Aerobic Exercise As a Tool Against NAFLD A non-randomized clinical trial segregated 90 NAFLD patients into two groups-case and control groups. Height, weight and BMI calculations were made on each participant. Liver enzymes (AST, ALT, ALP), fasting blood sugar (FBS) and lipid profile (TG, total cholesterol and HDL cholesterol) were measured. In the case group, when TG levels were above 400 mg/dl enzymatic method was used for calculating LDL cholesterol and in the control group, medical therapy with 1000 mg vitamin C and 400 units vitamin E were prescribed. Besides medical therapy (just like the control group) 30 minutes of aerobic exercise with maximal heart rate thrice a week for around 3 months was performed in the case group. Of the 90 participants 57 of them were men and 33 were women. In the case group, 29 were men and 16 were women while in the control group 28 were men and 17 were women and all of them were between 17 and 56 years of age. Once both groups were done with their stipulated duration of aerobic exercise performance serum levels of enzymes and liver echogenicity in individuals with NAFLD was decreased. It was observed that in the case group, 35 patients were in stage 1, 4 and 6 patients were in stage 2 without sonographic fatty liver. In the control group, 33 patients were in stage 1, 9 patients were in stage 2 and the fatty liver of 3 patients was resolved by sonography. Weight, BMI FBS, TG, HDL, AST, ALT and VFM values varied significantly before and after the trial in the case group. In the control group there was significant difference found in weight, BMI, SBP, DBP, TG and LBM values before and after trial. Effect of Resistance Training on NAFLD 21 NAFLD patients leading a sedentary lifestyle were involved in the study and each of them were randomly assigned to either the exercise (11 participants) or standard care (10 participants) group respectively. Physical examination, full medical history and fat measures (both subcutaneous and visceral) were done on each of the individuals. The exercise group performed resistance exercises on non-consecutive days for a period of 8 weeks for around 45-60 minutes daily with 10 minutes of warm-up session before the exercise. The programme involved eight exercises and the participants were encouraged to increase resistance used every week when possible. While 2 participants were removed in between the research quoting various reasons the other 19 participants completed the study. Results showed that BMI remained unchanged in both the groups during the study with insignificant changes seen in weight, waist or hip circumference, waist to hip ratio, body composition and visceral or subcutaneous fat in either group. There was a 13% reduction in IHL values witnessed in the exercise group on performance of resistance training with no changes seen in the control group. Three participants in the exercise group witnessed great improvements moving over from having significant NAFLD to staying within normal limits whereas none of the control subjects moved into the normal liver fat range. The exercise group also showed improved glucose control and significant improvement in insulin sensitivity. Fasting glucose levels also reduced in the exercise group after intervention compared to the control group. The study is a clear example that resistance exercises reduced IHL, increased insulin sensitivity and improved metabolic flexibility in NAFLD patients independent of weight loss. Evidences in Favour Of & Against Exercises End-stage liver disease (ESLD) and HCC are the final outcomes of fatty liver disease and we don’t have studies until now showing the effects of exercise on them. But logically, when individuals recover from NASH the risk of going into any of the other stages is minimal. A randomized control study by Eckard et al. focusing on lifestyle interventions that included daily physical activity showed significant reduction of NASH score. Another RCT on 31 NASH patients showed that 48 weeks of intense intervention pave way for a 2.4-point reduction of score. A 2012 meta-analysis done by Keating et al. on 439 subjects showed only a small reduction in liver fat content. A systematic review by Golabi et al. on 8 randomized trials on 433 individuals showed a 30.2% reduction in hepatic fat that was a result of regular exercising and a 49.8% reduction in liver fat that’s a result of a combination of both exercise and dietary intervention. There are a couple of studies that focused on the modality, intensity and duration of exercise that had a definite impact on NASH patients. An analysis of 813 NAFLD patients who were asked to self-report on their physical activity status came to the conclusion only those patients who performed vigorous physical activity were at a decreased risk of entering the NASH stage and those patients who doubled the exercise intensity decreased their risk of advanced fibrosis even further. Another study in Japan focusing on five cycles of HIIT training followed by 3-min recovery periods showed an optimal reduction in liver fat. Another study segregated 48 patients randomly into four different groups-low-intensity/high-volume, high-intensity/low-volume, low-intensity/low-volume and no exercise. While each group did experience a significant reduction in liver fat there was not much difference witnessed between the regimens. This shows that aerobic exercise done even at low-intensity reduces fat content of the liver. Another study by Bacchi et al. compared the effects of aerobic versus resistance training on 31 NASH patients over a 4-month period. While liver fat content did reduce there was no difference in results seen between the two exercise forms. A randomized trial on 196 subjects showed that aerobic exercise resulted in a greater reduction in hepatic fat content than resistance training program. But all these studies had one ideology in common-hepatic fat content decreased even when there as no change in weight loss observed in different studies. This clearly shows that physical activity and exercise have a direct impact on the liver. References The Effect of Physical Exercise on Fatty Liver Disease: https://www.ncbi.nlm.nih.gov/pmc/articles/PMC5954622/ The Effect of an Aerobic Exercise on Serum Level of Liver Enzymes & Liver Echogenicity in Patients with Non-alcoholic Fatty Liver Disease: https://www.ncbi.nlm.nih.gov/pmc/articles/PMC4017540/ Resistance Exercises Reduces Liver Fat & its Mediators in non-alcoholic Fatty Liver Disease Independent of Weight Loss: https://gut.bmj.com/content/60/9/1278  Waist Circumference is the Perfect Way to Predict Visceral Fat Deposition in your Body Our moms and grandmas are leading longer lives than expected seeing their grandkids and great grandkids attend school and college! They belong to a generation who is blessed to witness such a sight in their life and all this is because of advancements in science, especially in the field of health care. Life expectancy of the elderly generation is reaching new highs and so are their obesity rates. That’s because, ageing is accompanied by changes in body composition of individuals. Above the age of 70, both fat free mass and fat mass decrease with fat mass being redistributed in the visceral component and fat deposits are significantly visible in the skeletal muscle and liver. Body fat is mainly determined by the difference between energy intake and energy expenditure. Though there is no great increase in intake portion sizes in the elderly population their physical activity levels also witness a downslide and such decreased energy expenditure plays a prominent role in increasing fat mass with ageing. Also, there is a 2-3% decrease in resting metabolic rate every decade after the age of 20 and all these together account for decrease in energy expenditure with ageing.
But the actual question is whether obese elderly individuals must try to lose weight! For some of you who wonder what’s the point in asking questions when one is obese and there are clear evidences that obesity is a serious risk factor for heart diseases, diabetes, hypertension and hyperlipidaemia, I guess you have not heard of the obesity paradox! According to it, certain studies and meta-analyses show that a higher BMI can be protective of the elderly population decreasing (instead of increasing) their risk of death. There are various population-based studies that show that weight loss is linked to an increase in mortality rates; weight loss increases muscle loss (sarcopenia), there is a loss of the protective effect of fat (such as against hip fractures) and fat loss also exists which releases fat-soluble toxins into circulation. The next question is whether BMI is a good measure of body fat? In fact, it is not! People sometimes tend to lose height due to bending of the spinal cord as they age and, in such cases, some of them seem to have a higher BMI when their weight has not changed at all. Also, muscle loss, fat distribution and fat increase are not evident in BMI values. In such cases, waist circumference (WC) acts as a perfect measure for calculating obesity in older adults as this gives a clear picture of total fat and intra-abdominal fat. WC is extremely cost-effective, useful and can give a clear picture of the visceral fat adiposity levels in an individual. WC is one of the five criteria that defines metabolic syndrome which is in the first place linked to functional decline, frailty and disability. While ageing itself brings about disability, functional decline and loss of mobility studies show an association between BMI and mobility impairment. But there are very few which focus on WC as a factor for functional decline, falls and decrease in quality of life. Osteoarthritis (OA) is yet another reason for diminishing functional abilities in the elderly population and it also has the ability to increase changes in body composition that occur with aging. A study specifically focused on a cohort of older adults at risk for OA probing whether increased WC impacted quality of life, physical activity and daily life activities in these people. Osteoarthritis Initiative (OAI) Osteoarthritis initiative (OAI) is an observational study of osteoarthritis in adults aged between 45 and 79 years belonging to any ethnic group. Those suffering from rheumatoid arthritis, severe joint space narrowing, bilateral total knee replacements, unable to undergo an MRI, unable to provide blood samples or having any comorbidities were excluded from participating in the study. Baseline information in the form of questionnaires, interviews and physical assessment were collected. Every participant went through follow-up assessments annually and the present study used six-year outcome data for analysis. All the study participants were put into one of the three subgroups-clinically significant knee osteoarthritis at risk of disease progression, subjects at high risk of developing clinically significant knee OA (incident) and control group. Individuals in the progression subgroup complained frequently of knee symptoms or radiographic tibiofemoral knee OA in at least one native knee. Though the incident subgroup did not have baseline symptomatic knee OA they had certain other risk factors such as the presence of heberden’s nodes in both hands, increased weight, previous knee injury or operation, family history and pain in the knee on most days of the preceding month. The control group neither had pain nor risk factors or radiographic findings. Results The study consisted of 2,182 subjects whose height, weight and waist circumference were measured. Waist circumference was measured at the level of the umbilicus between the lower rib and the iliac crest. BMI was calculated as weight divided by height squared. Gait was calculated using the 20m walk test using which each of the participant’s walking speed was noted down. The study also measured occupational, household and leisure activities using the physical activity scale for the elderly (PASE) which is a 26-item questionnaire with greater scores indicating higher intensity of activity. Results showed that there was a higher proportion of women in the lower WC quartile and the number of medications increased with increasing WC quartile. Also, the proportion of individuals with knee OA increased by quartile. The study compared individuals who participated in the research to those who were excluded and found that the excluded individuals were older, less likely to belong to the female sex and were likelier to have higher comorbidities score and medications. They also had lower SF-12 (quality of life score) score at baseline but there were no differences found in PASE scores. The outcomes were measured at baseline and six years after start of study-it was found that SF-12 rates dropped as waist circumference increased at baseline and follow-up. A decline in PASE score was also observed over time and also between groups at baseline and 6 years after follow-up. Late-life disability index (LLDI) scores decreased at follow-up and activities of daily living (ADL) impairments increased significantly from 18% in the lowest WC quartile to 36.6% in the upper WC quartile. SF-12 values were observed to be age-dependent and those in the high WC quartile had lower scores than the lowest quartile. High WC quartile subjects had decline in PASE score compared to other categories but this was evident only in the 70+ age group. LLDI score also had maximum impact in the same age group compared to the low WC quartile. Also, gait speed was lowest in the highest WC quartile compared to other categories. Patients with OA had lower outcome measures compared to the low WC quartile. The study is a clear indication that high waist circumference is linked to decreased quality of life and physical activity. Hence, rather than focusing on BMI the primary focus must be to improve functional stability, manage weight and increase physical fitness in such a way that there is an overall improvement in physical performance and quality of life of the elderly individual. References The Impact of Waist Circumference on Functional and Physical Activity in Older Adults: Longitudinal Observational Data from the Osteoarthritis Initiative: https://nutritionj.biomedcentral.com/articles/10.1186/1475-2891-13-81 Obesity in the Elderly: More Complicated than You Think: https://www.mdedge.com/ccjm/article/96020/geriatrics/obesity-elderly-more-complicated-you-think/page/0/1 Obesity in the Elderly: https://www.ncbi.nlm.nih.gov/books/NBK532533/  Eliminating Belly Fat is not an Easy Task! It Requires Determination & Perseverance It’s not surprising when many individuals enroll for a gym membership or a weight loss program with the only aim of losing tummy weight. You might be slim and trim but there might be a small tummy protruding out of your Western outfit that screams for immediate attention. Some people accumulate fat around their thighs, some around their hands and hips but a majority of the individuals suffer from fat accumulation around their tummies (men are primary victims here). Worldwide, obesity and overweight have catapulted the lives of many and according to WHO, obesity is the accumulation of excess body fat that might impair health. Obesity rates have doubled since the 1980s becoming one of the primary reasons for the widespread prevalence of metabolic disturbance owing to increased intake of processed foods that are overloaded with sugar and unhealthy fats. Such excess fat accumulation have debilitating effects on the body’s health increasing levels of bad (LDL) cholesterol, lowering good (HDL) cholesterol levels, hinders body’s response to insulin thereby increasing blood sugar levels and prevails as the major risk factor for numerous diseases including heart attacks, strokes, high blood pressure, cancer, diabetes and even depression.
Abdominal Fat Any type of fat is bad and overweight is not appreciated but when it comes to health there is more concern placed on how much abdominal fat you have and not on how much you weigh. Though BMI exists as the commonly used measure for determining a person’s health this is not an exact measure as BMI only calculates total body fat without regarding how the fat is distributed. So, why does abdominal fat hold more importance than total body fat in determining a person’s health? Though we don’t have exact reasons scientists are indeed coming up with numerous convincing reasons for the same. Abdominal obesity (AO) is excess fat stored in two different abdominal regions-subcutaneous and visceral. Subcutaneous adipose tissue (SAT)is located in fatty tissues just beneath the skin acting like fat that’s present everywhere else in the body. This is neither too harmful nor helpful. Visceral adipose tissue (VAT) is that fat which is located around the internal body organs that exists as the primary health hazard. Such visceral obesity was linked with the overactivity of the body’s stress response mechanisms that raise blood pressure, blood sugar levels and heart risk. So, if BMI is not right maybe an MRI or CT would help us in measuring the amount of visceral fat. But not everyone can afford this right? One of the simpler methods is to measure the waist-to-hip ratio-a ratio measure above 0.95 in men raises the risk of heart attack or stroke while in women it is 0.85. But, much more convenient is the waist circumference (WC) that includes only one and not two measures. In today’s junk food world, there are a number of factors that contribute towards pronounced WC and VAT stores including sedentary lifestyle behaviours, absence from exercise routines and consumption of fatty and sugar-enriched foods. Research shows that VAT increases by more than 200% in men and almost 400% in women between the ages of 25 and 65. Besides food habits, smoking, alcohol consumption, age and hormones increase the risk of abdominal obesity. It has also been observed that VAT levels increase during pregnancy and menopause starting right from perimenopause and going up to the end of menopause. Getting Rid of Abdominal Fat: A Click Away? It is common these days to see ads and social media marketing platforms trying to lure clients by coming up with newer ideas and weight loss gimmicks including the ones such as: the secret pill for belly fat reduction or “Dissolve belly fat within 10 days by drinking this daily!” This makes it even more difficult for health and nutrition experts qualified in diet and nutrition counselling to come up with better solutions that are practical yet effective to help people stop from falling a prey to such gimmicks and take up the best solution to correct abdominal obesity. The right approach is to follow a healthy diet by creating recommended calorie deficits suitable for the individual’s body type and practicing daily exercises. The point now is whether there are specific dietary approaches, nutrients suggested or foods recommended to fight abdominal obesity. Given below are some of the studies that have dealt dealing with abdominal obesity with dietary and exercise measures. Meta-analysis & Review of Randomized Control Trials Though we have studies showing the effect of exercise on abdominal fat there are not many reviews that deal with lifestyle interventions for AO. Databases such as Medline and Embase were searched thoroughly for randomized control trials (RCTs). A 12-month data was used for the study independent of the length of the intervention. Though the search came back with more than 2900 records, there were 15 trials selected for analysis based on different restriction criteria. All except 3 were lifestyle interventions that proposed diet and physical activity changes. Each of the study included anywhere between 34 and 439 participants and the studies were conducted between three months and three years. Results showed that participants in a behavioural change program reduced WC by -1.88 cm and those in a combined program lost a mean of -4.11 cm. Meta-regression analysis showed a mean difference of -2.39 cm between both types of programs showing that a combined approach is the best way possible. Three studies focusing on gender observed that male participants lost a mean of -2.61 cm WC and female participants reduced their WC by -1.63 cm. Of the six studies that practised combined intervention, four chose a physical activity (PA) component, one a very low-calorie diet and another one tested diet and PA separately as well as combined with the combination giving the best result. Effect of Diet on Postmenopausal Women The study here focused whether exercise in combination with diet restriction reduced abdominal fat to a greater extent that one triggered by diet alone. This study is a secondary analysis of the SHAPE-2 study (SHAPE was the Sex Hormone and Physical Exercise study designed to find out the effect of weight loss with/without exercise on biomarkers of postmenopausal breast cancer risk) in which 243 healthy overweight or obese postmenopausal women participated. Eligibility criteria included postmenopausal women, having a BMI between 25 and 35, insufficiently physically active and not diagnosed with diabetes or cancer. There was a 4-6 week run-in period at the start of the study in which a personalized standardized diet that conformed to the Dutch National Guidelines for a Healthy diet (50-60% carbohydrates, 15-20% protein, 20-35% fat, a max of 1 alcoholic drink daily, >25g of fibres per day, 200g of vegetables and 2 servings of fruits) was prescribed. The run-in period was mainly designed to find out the macronutrient intake among participants and stabilize body weight. Study participants were split into one of the three groups: diet group (97 participants), exercise plus diet group (98 participants) and control group (48 participants) respectively. The intervention programs were designed with an aim of reducing 5-6 kg of body weight in 10-14 weeks’ time. Dietitians and physiotherapists monitored the participants’ weight loss performance and self-weighing was performed. When weight loss did not meet or exceed 0.5 kg/week in participants for 3 consecutive weeks there was extra attention given to these participants to change their diet or exercise routine. After weight loss goal was achieved, a weight maintenance (2-6 weeks) was started that included balancing between intake and expenditure levels. Participants in the diet group were given a diet with a calorie restriction of 3500 kcal/week and asked to maintain their regular physical activity. Participants in the exercise plus diet group followed a 4h/week exercise program (this included an energy expenditure of 2530 kcal/week). The exercise program included two 60-min group sessions of combined strength and endurance training conducted by physiotherapists and two 60-min Nordic walking session per week. This exercise intervention was combined with a small caloric intake restriction of 1750 kcal/week to enable 5-6 kg weight loss in a short time. All participants were regularly monitored by phone calls from dietitians. Results Abdominal fat measurements (subcutaneous abdominal adipose tissue (SAAT) and intra-abdominal adipose tissue [IAAT]) were taken at baseline and after 16 weeks. SAAT and IAAT were summed together to obtain total abdominal adipose tissue (TAAT) measurements. Total body fat, lean mass, height and body weight measurements were also taken. At the end, 92 women in the diet group, 94 in the exercise plus diet group and 45 in the control group completed the study. Almost 70% of women at least attended four diet-group sessions and 81% attended the group exercise session. Participants in the diet group lost -4.9 kg and -5.5 kg in the exercise plus diet group. There was a -2.8% and -4.4% decrease in body fat percentage with diet and exercise plus diet group respectively. Exercise plus diet group lost more body fat percentage compared to other groups. Compared to the control group, TAAT, SAAT and IAAT decreased significantly in both intervention groups. TAAT and SAAT decrease was significantly larger in the exercise plus diet group compared to the diet group-a difference of -15 cm2 for TAAT and -11 cm2 for SAAT. There was slightly more decrease seen in IAAT measurements in the exercise plus diet group than in the diet group compared to control. The study found a 6-7% weight loss in healthy and overweight-to-obese postmenopausal women that led to a reduction in both intra-abdominal and abdominal subcutaneous fat. Weight loss that occurs as a combination of both exercise and calorie restriction paved way for enhanced changes in subcutaneous abdominal fat but with no changes in intra-abdominal fat when compared to weight loss induced by calorie restriction only. Recent Trends in Managing Abdominal Obesity Intermittent Fasting (IF): Though there is no standard protocol followed for intermittent fasting the general approach includes some level of fasting or energy restriction for 1-3 days/week with or without restriction on the remaining days. But a systemic review of 12 studies comparing IF with continuous energy restriction diets showed that all diet patterns resulted in similar weight loss and reduction in waist circumference irrespective of fasting or energy intake timings followed. High Protein Diet: Proteins have always been considered as a friend of weight loss as it gives enhanced satiety and resting energy expenditure. But there are no convincing evidences from studies showing that a higher protein diet reduces abdominal obesity compared to other energy-restricted diets. Palaeolithic-style Diet: This diet trend tries to mimic the eating habits of our early Palaeolithic age ancestors that includes elimination of certain food groups and foods not available during the Palaeolithic era. There are very few studies that focus on this diet as a means to reduce abdominal obesity and the information from them are also not convincing to say that a Paleo-style diet is a good target to curb abdominal obesity. Green Tea: Green tea has been sought after for its benefits in effective weight loss including reducing abdominal obesity. Green tea catechins (GTC) have been said to have a synergising effect on energy expenditure, fat absorption and fat oxidation. Although GTC show advantages in animal studies the dose needed for creating significant difference in WC in humans display unrealistically high quantities. DASH & Mediterranean Diets: The NIH-developed Dietary Approach to Stop Hypertension (DASH) diet and the Mediterranean diet were selected as the “2018 Best Overall Diets” as both of them are great options to encourage individuals to incorporate them in their daily lives for weight loss benefits. The DASH diet promotes weight loss and reduces risk of heart disease while the Mediterranean diet leads to lower cardiometabolic disease rates. There is no one specific magic diet, food or ingredient that can promote weight loss, especially abdominal obesity reduction. It is always better to eat a healthy diet and perform regular physical activity to lose weight and stay healthy. Don’t get swayed away by misleading information about the latest trends for belly fat. It is always better to get in touch with registered dietitian nutritionists to get yourself going with the best diet plan that suits you instead of going behind those that eliminate food groups or promote fasting as a means to lose weight. References Therapeutic Treatment for Abdominal Obesity in Adults: https://www.ncbi.nlm.nih.gov/pmc/articles/PMC6121087/ Effect of Diet With or Without Exercise on Abdominal Fat in Postmenopausal Women- A Randomized Trial: https://bmcpublichealth.biomedcentral.com/articles/10.1186/s12889-019-6510-1 Targeting Abdominal Obesity Through the Diet: https://journals.lww.com/acsm-healthfitness/Fulltext/2018/09000/TARGETING_ABDOMINAL_OBESITY_THROUGH_THE_DIET__What.8.aspx?WT.mc_id=HPxADx20100319xMP  Kids Who Eat Low-GI Goods are Less Prone to Overweight Issues We live in a period in which overweight/obesity rates are overpowering normal body weight in kids and adults equally. While dietary factors hold primary responsibility its also our sedentary lifestyle and physical inactivity that play an equal role in triggering excess body weight in kids, adolescents and even toddlers. This excess body weight now exists as one of the biggest medical problems around the world affecting people from all walks of life disrupting their quality of living. Some of the major long-term issues include diabetes mellitus, dyslipidemia, hypertension, sleep apnea, musculoskeletal problems, gastrointestinal disease and psychosocial difficulties. Overweight/obese kids (above the age of 7) have maximum risk of growing into obese adults with increased risk of cardiovascular disease. Even the World Health Organization (WHO) shows that overweight and obesity exist as the leading cause of premature death worldwide and as a serious risk factor for mortality during adulthood too.
Obesity is nothing but body weight ranges well above the defined limits which leads to higher body mass index values and waist circumference. Statistics show that obesity rates in America have more than doubled in the past few decades and the results are almost similar elsewhere too - India is becoming one of the top countries with maximum childhood and adult obesity rates, the incidence of obesity and overweight in the Iranian population is 10.1% and 4.79% respectively and Brazil has experienced a drastic nutritional transition from decrease in malnutrition to increase in obesity/overweight rates. Though genetics and environmental factors do play an integral role in determining obesity risk in kids most researches also show that macronutrient composition of the diet is equally important to maintain normal body weight. Studies focus on dietary fats and carbohydrates too as a factor for weight control. Carbohydrate Quality Using Glycemic Index Some of us have heard the term glycemic index while for others it might be something new. It was Jenkins et al. (1981) who used the term ‘glycemic index’ first to define carbohydrate quality. What is this glycemic index (GI)? It is nothing but the ability of the food to increase blood glucose 2 hours after eating that kind of food. According to Jenkins GI refers to the area under the blood glucose curve measured two hours after consuming 50g of carbohydrates with respect to the results obtained by consuming 50g of glucose or white bread. The term glycemic load (GL) was introduced in 1997 to quantify the overall glycemic effect of food with respect its specific carbohydrate content in typically consumed quantities. GL is calculated by multiplying amount of GI with carbohydrate amount in grams. High GI and GI diets are rapidly digested, absorbed and transformed into glucose which pave way for higher chances of glucose fluctuations, early signs of hunger and increased calorie consumption. Meanwhile, a low GI and GL diet takes time for digestion, releases glucose and insulin slower into the bloodstream and increases satiety levels decreasing calorie consumption. Maybe some of you now remember our physician’s clinic or hospital that notifies patients on the list of low GI and high GI foods that need to be consumed and avoided. But studies on the relationship between these indices with obesity rates in individuals come up with controversial results-either supporting, rejecting or showing no changes between the indexes and obesity rates. A meta-analysis published in 2003 shows that low glucose index (LGI) are advantageous for glycosylated hemoglobin (HbA1c) in type 1 and type 2 diabetics compared to high glucose index (HGI) diets. We do have studies showing that consumption of high GI/GL diets increased the risk of type 2 diabetes. But most of these studies focus primarily on the adult population and the study below shows the effect of LGI and LGL on anthropometric parameters, blood lipid profiles and indicators of glucose metabolism in kids and teens below 18 years of age. Systemic Review The systemic review was performed using the electronic databases MEDLINE and EMBASE with search terms such as ‘glycemic index’ and ‘glycemic load’. Apart from keywords other inclusion criteria were that they must be randomized control trials (RCT), age of participant <18 years of age, they must be humans and markers such as BMI, height, weight, waist circumference, hip circumference, waist-to-hip ration, systolic blood pressure (SBP), diastolic blood pressure (DBP) and fasting serum insulin (FI) must exist in the studies. The search came up with a total of nine studies consisting of 1359 articles and 1065 participants that met the study criteria and was now eligible for meta-analysis. All the nine studies were randomized control trials (RCTs) which had a duration between 10 and 96 weeks. Results showed that:
Effect of Cohort Studies on Kids with Obesity A study split participants into two teams-one team received a diet low-GI diet and the other a reduced-fat diet (emphasis was placed on limiting intake of high-fat, high-sugar and energy-dense foods while increasing consumption of grain products, vegetables and fruits). Though 190 participants were initially included only 107 remained as the others were not regular for follow-up. All the participants received medical evaluation, dietary counselling and lifestyle counselling in the presence of at least 1 parent. Each of them was called for follow-ups every month for the first 4 months and thereon, as and when needed. In the reduced-fat intake group energy restrictions of approximately 1042 kJ to 2084 kJ per day was imposed compared to normal energy intakes. Macronutrient intake goals were set at 55-60% carbohydrates, 15-20% protein and 25-30% fats. The other diet was designed to provide the lowest GI possible but satisfying all nutrient requirements for kids. Here, there was more importance given to food selection and not energy restriction. This diet varied from regular diets mainly in the macronutrient ration where participants were asked to combine low-GI carbohydrate, protein and fat at every meal and snack. Macronutrient intake goals here were 45-50% carbohydrates, 20-25% proteins and 30-35% fats. Results showed that for each BMI tertile, the low-GI group showed a larger decrease in BMI compared to the reduced-fat group. Also, a larger percentage of patients in the low-GI group experienced a decrease in BMI compared to the reduced-fat group. Kids who were fed with reduced-fat diet showed no change in adjusted BMI whereas children fed with low-GI diet showed a BMI decrease of 1.15. A low-GI diet might promote weight loss by lowering insulin levels. Effect of GI & GL on Brazilian Children A study in Brazil conducted to observe the effect of glycaemic index and glycaemic load on hunger and high-energy intake and the risk of overweight/obesity and high adiposity in kids involved 5-year-old children whose adiposity, weight and nutrient index was assessed. GI of every food consumed by the kids was noted down and the kids were segregated into one of the 4 groups-under weight (7), normal weight (185), overweight (38) and obese (2). Overweight/obesity prevalence was 16.2% in the case of boys and 18.9% in case of girls. Meat, egg and margarine contain no carbs and do not contribute towards GI calculations. Only 87.7% of the foods in the food-frequency quantitative questionnaire (FFQQ) contributed to glycemic diet profile and the rest were categorized in the following frequencies: cereals and beans in 3-4*/week, milk/dairy products and sugar-added drinks in 2-3*/week, bakery products/biscuits, vegetables, fruits and sweets in 1-2*/week. Results showed that kids from families with higher per capita income and moms with higher education levels had better glycemic profiles. Overweight group had a higher median carbohydrate intake than the normal weight group. It was generally seen that kids consumed significantly higher carbohydrate levels. They consumed more of cereals and beans followed by sugary drinks which are high in simple carbs thus contributing to an increased dietary GI. Fruits and vegetables that are low in GI and containing high fiber was consumed in lower proportions comparatively. Also, the cereals consumed were all refined ones. The study showed that the overweight group had higher GI and GL levels compared to the normal weight group. References Effects of Low Glycaemic Index/Low Glycaemic Load vs. High Glycaemic Index/High Glycaemic Load Diets on Overweight/Obesity & Associated Risk Factors in Children & Adolescents: https://nutritionj.biomedcentral.com/articles/10.1186/s12937-015-0077-1 A Low Glycaemic Index Diet in the Treatment of Paediatric Obesity: https://jamanetwork.com/journals/jamapediatrics/fullarticle/350858 Influence of Glycaemic Index & Glycaemic Load of the Diet on the Risk of Overweight & Adiposity in Childhood: https://www.sciencedirect.com/science/article/pii/S2359348216000129  Breastfeeding is the Best Escape Plan from a Variety of Health Problems Every child deserves to be fed with breastmilk exclusively up to the kid’s 6th month unless and until the situation demands otherwise and there is nothing that can be done to avert it. Colostrum, the first milk that is fed soon after the child is born cannot be equalized with any formula milk for its nutrition content-its nature’s gift to every infant born unto this world. Every person in this world values breastmilk and there are not many who are unaware of its advantages on both, the infant and the mother right from offering protection against a range of diseases to supporting the individual in tackling health issues and improving overall wellness. Research even shows that breastfeeding is linked to a number of benefits including a lower risk of ear infection, asthma, respiratory tract infection, obesity, diabetes mellitus and leukemia. We also have data supporting the fact that breastfeeding has a definite impact on the kid’s cognitive development, attention deficit hyperactivity disorder (ADHD) and other behavioural problems.
Though we generally define kids as having their father’s traits most of the times it is the mother’s IQ level that’s predictive of the child’s IQ. This brings upon a valid point that the mom’s IQ should be considered while trying to link between breastfeeding, child’s IQ and child’s behavioural outcomes. This is highly necessary as it does bring about stupendous changes in researches. For instance, a study by Der et al. found that while breastfeeding was associated with a 4-point increase in child’s IQ taking the mother’s IQ into consideration reduced this increase by more than 75%. Given here is yet another study that focuses completely on the effects of breastfeeding on the child’s cognitive development and behavioural problems when the mother’s IQ is given priority. The study focused mainly on two points: there is a link between breastfeeding, ADHD and behavioural problems when the child’s IQ and maternal IQ are controlled and there is a definite link between breastfeeding and child’s IQ even after controlling for ADHD and maternal IQ. Studying the Effects between Breastfeeding & Cognitive Development in South Korea Children in grade 3 and 4 aged between 8 and 11 years were selected from 13 different schools to participate in the study. Each of the mothers was questioned on the type of feeding practise followed and put into either of the two groups-breastfeeding group when the child was breastfed or mixed fed or non-breastfeeding group when the child was bottle fed. Each of the kids were analysed for the presence of ADHD using a highly structured diagnostic interview and the Korean version of the child behaviour checklist (CBCL) to find out about the behavioural symptoms of the child. The CBCL finally consists of three broadband scores namely internalizing, externalizing and total behavioural problem score with a score of 63 and above defines clinically significant symptoms based on previous studies as well. While the kids were administered the Korean Educational Development Institute’s Wechsler Intelligence Scales for Children (KEDI-WISC) each of the mothers completed a shorter form of the Korean Wechsler Adult Intelligent Scale (K-WAIS). The researchers looked out for differences in socio-economic variables between those children who were breastfed and those who weren’t using a series of tests. Also, to find a link between a child’s IQ and behavioural outcomes the prevalence of ADHD was compared to the internalizing, externalizing or overall behavioural problems among children with IQs <100,100-115 and >115. After adjusting for various parameters, logical regression tests were performed using the presence of ADHD and either internalizing, externalizing or overall behavioural problems as the outcome variable to find an association between breastfeeding and the child’s behavioural outcomes (Model 1). Models were adjusted for the child’s IQ (Model 2) and all predictive variables were concurrently entered into the model and adjusted odds ratio (AOR) for breastfeeding was calculated. Results The study included a total of 874 participants of which 522 (59.7%) of them were breastfed and 352 (40.3%) were not breastfed during their infancy period. Though there was not much socio-demographic differences between the two groups both, the mother’s and the child’s IQ were significantly higher in the breastfeeding group than in the non-breastfeeding group. Results showed that:
Effect of Breast Milk on Preterm Infants A group of adolescents who were born preterm were examined in this study since their birth. Those adolescents who received breast milk as infants had an 8.3-point IQ advantage at 7-8 years. Information collected on these subjects in the neonatal unit provided information on the volumes of breast milk consumed which enabled researchers to find the link between the effect of breast milk dose on cognition abilities in these adolescents. IQ level was measured using age-appropriate Wechsler IQ tests and 44 completed the test pertaining to kids and 6 of them completed those pertaining to adults. Information on cognition were collected during the hospital visit for MRI acquisition. Of the 100 participants involved in the study the IQ scores of all the girls and boys involved did not show significant difference. While breast milk intake showed positive effect on all but most significantly in boys, the effect of breast milk was seen strongly on grey than white matter in the brain. It was also seen that the beneficial effects of breast milk on the child’s IQ could be improved more by promoting the development of white matter. While boys and girls did not differ in mean IQ values, they showed difference in the relationship between IQ and both diet and neural volumes. But now, we have a latest study on 8,000 babies in Ireland done over a 5-year span assessing the effect of breastfeeding on cognitive abilities in these children that shows a different result. Only full-term babies were involved in the study and were grouped according to how long they were breastfed-31 days, 32-180 days or ≥181 days. All the kids were tested for cognitive abilities that included problem-solving skills, vocabulary at ages 3 and 5 years. The researchers found that those babies who were breastfed showed only a small benefit in hyperactivity at age three while there was no significant benefits witnessed at age five (once the kid starts schooling). References Protective Effect of Breastfeeding with Regard to Children’s Behavioural & Cognitive Problems: https://nutritionj.biomedcentral.com/articles/10.1186/1475-2891-13-111 Impact of Breastmilk on IQ, brain Size & White Matter Development: https://www.ncbi.nlm.nih.gov/pmc/articles/PMC2939272/ Breastfeeding Doesn’t Boost Children’s Intelligence: https://www.nhs.uk/news/pregnancy-and-child/breastfeeding-doesnt-boost-childrens-intelligence/  Optimize Sleep-wake Cycles by Using Melatonin Sleep is a blessing that’s not bestowed on many of us. Kids hate to sleep, adolescents are in love with sleep, middle-aged people don’t have enough time for sleep while elderly struggle to get some quality sleep. Sleep is a neurochemical process that involves sleep-promoting and arousal centres in the brain and is indispensable for brain energy restoration, memory consolidation, information processing and brain metabolite clearance. All these functions together determine our brain development, physical and mental health and cognitive abilities. Sleep is essentially divided into two important states namely the rapid eye movement (REM) and non-rapid eye movement (NREM) between which every human alternate throughout the night. It has been well-established that the common civilian suffers from sleep-related problems and there is no doubt that sleep quality is of dire concern for military people too. A cross-sectional study on 156 US Air Force Airmen revealed that at least 40% of them suffered from sleep disturbance and at least 75% of them complained of decreased sleep quality while deployed compared to their sleep quality at home. There are other studies which come up with similar results. Though we do offer solutions in the form of medications such as zolpidem they do have side-effects including cognitive impairment that prevents individuals from relying on them for support. Delayed sleep-wake phase disorder (DSWPD) is a sleep disorder that prevents the individual from sleeping and waking up at a stipulated time to go to school, work or college primarily due to chronic sleep restrictions and adverse mental health, financial, economic and social outcomes. So, what can replace these unreliable meds without any side effects in all of these situations? The answer could be melatonin.
Gratifying Sleep with Melatonin Suffering from cold or mild fever? Its time for Crocin. Just like how Crocin and any Paracetamol has become synonymous with fever/cold people these days have started using melatonin as sleep-promoting pills for people suffering from sleep-related problems, jet lag issues, rotational shift work and to balance circadian rhythm due to odd-hour jobs/travel. Melatonin plays a bigger role in regulating the body’s sleep-wake cycle. There are studies that show that using melatonin supplements increase the individual’s inclination to sleep but does not act as an effective prescription sleep medication. We need studies to prove that melatonin could be an effective aid for promoting sleep and discussed below is a systematic review that takes tries to explore the effectiveness of melatonin, assess its safety and realize the possibility of using it as a treatment plan for those suffering from sleep-related disorders. Systematic Review of Randomized Control Trials Databases such as PubMed, MEDLINE, Embase and Agricola were searched for Randomized Control Trials (RCTs) that dealt with melatonin use and healthy sleep behaviour in individuals. Only those RCTs that met certain criteria such as including adult humans, healthy military or non-military population or populations diagnosed with insomnia, use of melatonin as intervention and had at least one sleep outcome of interest such as sleep latency, sleep quality and sleep duration were included. Three reviewers reviewed all the articles and extracted descriptive data such as population description, sample size, melatonin and control interventions and dosages. The subject matter experts (SMEs) analysed each RCT to find out 1. The confidence level in the estimate of the effect, 2. Determine magnitude of the effect size overall, 3. Assign a safety grade to the literature and 4. Develop recommendations for melatonin literature based on REAL results for overall literature pool of studies for every category. After imposing all eligibility criteria, the researchers were left with 35 RCTs that include a total of 2,356 subjects. All the studies were categorized based on their intended use:
8 RCTS that included 300 participants analysed the efficiency of melatonin in promoting sleep in shift workers but could not come to any conclusive results. Another 8 RCTs including 972 participants tested melatonin use on counteracting jet lag-one study neither favoured the melatonin group nor the control group, six studies favoured melatonin and one other study showed that melatonin increased tiredness the next morning. 4 studies including 845 participants tested the efficiency of melatonin in promoting better sleep in people with insomnia. Of the 4, 2 of them neither favoured melatonin nor controls and the remaining two studies favoured melatonin use. The SMEs did not provide great recommendations in using melatonin as a solution for promoting sleep in persons with insomnia. 15 RCTs with a total of 223 participants looked into the use of melatonin for promoting sleep in healthy volunteers. Of the 15, 3 were of poor quality and 12 were high-quality studies. Two of the three poor-quality studies favoured melatonin while the last one did not favour either groups. 8 of the 12 high-quality studies favoured melatonin use while the other 4 did not show beneficial effects of both the melatonin and the control group. 7 studies looked into the efficiency of melatonin on initiating sleep quality and of them 6 of them were of high-quality. 5 of these 6 high-quality studies displayed results in favour of melatonin. 4 of the 5 studies that looked into the effect of melatonin on daytime sleepiness showed results supporting the use of melatonin. All the studies dispensed different quantities of melatonin ranging between 0.3 to 10.0 mg/day with all of them except two using capsules. Role of Melatonin as a Regulator of Circadian Clock & Insomnia Insomnia, primary due to environmental, social and occupational cause includes difficulty falling asleep or maintaining sleep for at least 1 month that manifests as daytime distress or impaired social, occupational and other areas of functioning. It has been evident that melatonin production decreases with age and the link between increasing age, declining melatonin production and increasing insomnia prevalence has paved way for ‘melatonin replacement’ hypothesis which shows that replacing the lost hormone levels can improve sleep. A meta-analysis looking into the effectiveness of melatonin in both normal people and those suffering from insomnia showed significant reduction of sleep onset latency following immediate release (IR) melatonin consumption but the same did not improve any other aspect of sleep quantity. Placebo-controlled trials that used a prolonged-release melatonin (PRM) formulation addressed the efficiency and safety of melatonin replacement therapy for insomnia in patients aged 55 and above. Results showed that PRM helped in improving sleep quality and shortening sleep latency thereby improving quality of life. A 10-year follow up on 20,432 men and women aged 20-65 years with no history of cardiovascular disease showed that poor sleep quality increased the risk of cardiovascular and coronary heart disease; decreased slow wave sleep (SWS) increases the risk of hypertension by almost 2-folds and the circadian rhythm of BP is blunted in patients with insomnia. It has been shown that an impaired melatonin production has been observed in all these patients and melatonin deficiency alone or in combination with poor sleep quality might be related to an impaired nocturnal BP fall. Studies show that melatonin improves sleep in hypertensive patients with sleep disorders. Efficiency of Melatonin on DSWPD Patients A double-blind, randomized control trial was followed in the delayed sleep on melatonin (DelSoM) study in which the participants were males and females aged between 16 and 65 years with a BMI between 18 and 35. All the participants suffered from DSWPD and participants were classified as having a delayed circadian phase angle if the DLMO occurred within 30 minutes before their reported desired bedtime (DBT) or any time after DBT. Individuals with DLMO occurring up to 30 min before DBT were classified as having circadian delay. Those individuals with circadian delay were randomly segregated into the placebo or intervention group (0.5 mg fast-released melatonin). The participants were given 28 medication capsules and advised to take the capsule at the same time daily 1 hour before their fixed DBT and also try to sleep at their DBT daily for at least 5 consecutive nights of every 7 nights for 4 consecutive weeks. Sleep-wake monitoring continued with sleep diaries and all the participants continued to note down their daily work schedules. Sleep diary reports of bedtime, sleep offset time, sleep onset latency (SOL) and wake after sleep onset (WASO) was used to calculate the subjective sleep variables of time in bed (TIB), sleep onset time, total sleep time (TST) and SE (calculated between sleep onset and sleep offset). A total of 307 patients were included in the study of which 187 attended the laboratory-based circadian phase assessment and 116 were randomized to treatment. 186 completed the circadian phase assessment but 62 of them did not have circadian misalignment between DLMO and DBT and hence, were excluded from the trial. The study was left with 104 patients in the completed treatment analysis. The total number of nights for which the patients followed the treatment plan did not differ between the groups and neither was there any change in circadian timing of scheduled treatment. Going to bed early in the placebo group was linked to longer SOL and lower SE and this improved with melatonin treatment. Compared to placebo group, the melatonin group had 44-min earlier subjective and 34-min earlier actigraphic sleep onset time, 38-min-earlier subjective sleep offset time, 3% higher SE for the entire sleep episode and 5.14% higher SE T1. Post hoc analysis of all nights of the treatment period showed the melatonin group had a 29-min earlier sleep onset time and 4.37% greater SE T1 compared to the placebo group. Sensitivity analyses (including only those nights when the subjects took treatment) showed that compared to the placebo group, the melatonin group had earlier actigraphic sleep onset time, higher SE T1, shorter subjective and objective SOL, earlier subjective sleep onset and offset time and higher actigraphic SE for the entire sleep episode. The research showed that short-term, low-dose melatonin administration in a treatment protocol with behavioural sleep-wake scheduling is an effective and safe treatment for DSWPD patients suffering from circadian misalignment and the treatment paved way for improved sleep quality and overall functioning. References The Effectiveness of Melatonin for Promoting Healthy Sleep: A Rapid Evidence Assessment of the Literature: https://nutritionj.biomedcentral.com/articles/10.1186/1475-2891-13-106 New Perspective on the Role of Melatonin in Human Sleep, Circadian Rhythms & their Regulation: https://www.ncbi.nlm.nih.gov/pmc/articles/PMC6057895/ Efficiency of Melatonin with Behavioural Sleep-wake Scheduling for Delayed Sleep-wake Phase Disorders: A Double-blind, Randomized Clinical Trial: https://journals.plos.org/plosmedicine/article?id=10.1371/journal.pmed.1002587  Kids with ADHD Often Engage in binge-eating Behaviour Leading to Weight Gain  Attentivity is the Foremost Problem of ADHD as its Name Indicates! Attentivity is the Foremost Problem of ADHD as its Name Indicates! Unable to focus on something that’s happening at class? Cannot resist the urge to keep moving around even when it’s not feasible? Do you keep disturbing others often? A yes to these might not only ruin your quality of life but also destroy your peace as all of them are signs of attention-deficit/hyperactivity disorder (ADHD). ADHD is a behavioural problem whose common symptoms include inattentiveness, hyperactivity and impulsiveness. Though this is not confined to children symptoms of ADHD are noticed at an early age and diagnosed accurately when the kid is between 6 and 12 years of age. In general, kids are restless and their attention span is short. Every kid might go through phases in life where they are restless and inattentive and this doesn’t confirm the presence of ADHD. If you notice things are radically different it is better to speak with the physician.
The prevalence rates of the disease have increased in the last two decades due to various factors including changes in environmental and epigenetic factors apart from increased awareness, improved screening methods and pharmaceutical marketing. Most of the symptoms linked with ADHD are due to reduced dopamine activity in the brain and course of treatment includes methylphenidate or amphetamine-containing medications that help in increasing dopamine availability in the brain. Pharmacotherapy is sometimes combined with psychotherapy but medications don’t relieve the symptoms completely and moreover, their side effects such as sleeping-related issues, reduced taste perception and appetite lead to lower adherence rates among children. Hence, physicians focus more on alternative therapies that include lifestyle changes and altered diet intake that can reduce the symptoms. Though parents have the common perception that ADHD children are mostly underweight due to heightened activity levels there are many of them who are obese/overweight as these kids often engage in binge-eating behaviour and the dysregulation of neurotransmitters can affect appetite and satiety levels too. We have conflicting results on the proposed dietary restrictions that could reduce ADHD symptoms in kids including avoidance of sugary foods, food additives and colour preservatives. There have been trials on what’s called the ‘Few Foods Diet’, a diet that’s based on lamb, rice, lettuce, pears and water that has decreased inattention and impulsivity among kids but most of the research in ADHD focus only on a group of foods rather than looking at the overall dietary pattern. The Dietary Pattern & Not Certain Ingredients Impact ADHD To study better about ADHD and learn how nutrition has an impact on it, we need more information about dietary pattern that’s more revealing as nutrients interact with each other affecting the health of children in comparison to their effect when taken as a single nutrient. We have evidence that a dietary pattern characterized by more intake of saturated and trans-fat and lesser intake of omega-3 fatty acids, fibre, fruits and vegetables was linked to increased ADHD risk in kids aged 14 years in an Australian cohort study. Another case-controlled study found that adhering to a diet that’s rich in fish, white meat and other mineral-rich foods was associated with fewer ADHD symptoms in children. The study below looks at the impact of ADHD on nutrient intake over time in a population-based sample of school-aged kids. Generation R Study The study here used data from the Generation R Study which had information on 7893 live-born children. All kids who completed the Child Behaviour Checklist (CBC) at ages 6 and 10 years and a semiquantitative FFQ at age 8 years were included in the present analysis which left the research team with 3680 children. Symptoms for ADHD were measured at ages 6 and 9.7 years using a child behaviour checklist (CBCL) that could be filled by parents or caretakers. The subscale contained six ADHD problems involving “can’t concentrate” “can’t sit still,” “can’t stand waiting,” “demands must be met,” “gets into everything” and “quickly shifts.” The parents rated these pointers in a 3-point scale resulting in a score ranging from 0 to 12. In kids aged around 10 years the CBCL scale was used for 7 items that included “fails to finish things,” “can't concentrate and can't pay attention for long,” “can't sit still,” “impulsive or acts without thinking,” “inattentive or easily distracted,” “talks too much,” and “unusually loud.” The kids’ dietary intake was analysed using an FFQ which was filled by parents or caregivers. The diet quality score was set based on adherence to a Dutch dietary recommendation for children and the ingredients used for scoring included fruit (≥150 g/d), vegetables (≥150 g/d), whole grains (≥90 g/d), fish (≥60 g/wk), legumes (≥84 g/wk), nuts (≥15 g/d), dairy (≥300 g/d), oils and unsaturated fats (≥30 g/d), sugar-containing beverages (SCBs; ≤150 g/d), and high-fat and processed meat (≤250 g/wk) (42). The kids were given a score between 0 and 1 depending on the quantity of the food consumed. For example, a score of 0 for fruits meant that the child did not consume any fruits, a score of 0.5 indicated that he/she consumed 75 grams of the recommended 150 grams/day and a score of 1 meant that the kid consumed ≥150 g/day. Reverse scoring was used to mark sugar containing beverages (SCB), high-fat and processed meat with higher scores indicating lower consumption. Total score was the sum of the 10 component scores that ranged between 0 and 10 with higher scores indicating a healthier overall diet. Results Of the 3680 kids, 70.4% were of Dutch origin and 14.5% were overweight/obese. 50% kids spent more than 2 hours a day watching TV or using smartphones and participated in sports between 2 and 4 hours every week. Around 6 years of age, 0.6% of kids used medication for ADHD which increased to 3.3% at age 10 y. The researchers tried to understand whether ADHD symptoms at age 6 were associated with dietary patterns after 2 years. The researchers found an inverse association between ADHD symptoms at age 6 and diet quality at age 8 years and the association remained significant when adjusted for social and lifestyle factors. In another set of linear aggression, a higher diet quality score at age 8y was linked to a lower ADHD symptom score at age 10y implying that a 1-point higher diet quality was linked to a 0.02 lower ADHD symptom. The researchers found a significant inverse association between ADHD symptoms at age 6y and dietary pattern at age 8y and no association between dietary pattern at age 8y and ADHD symptoms at age 10y. It was also found that association of diet quality with ADHD symptoms was not significantly different for boys and girls or even between children who were obese/overweight compared with those who were not. Even after the exclusion of specific diet groups one by one, there was a similar association found for ADHD with diet quality. The study clearly proved that ADHD symptoms in childhood are associated with a poorer diet quality but it’s not true the other way around. References Children’s Attention-deficit/Hyperactivity Disorder Symptoms Predicts Lower Diet Quality but Not Vice Versa: Results from Bidirectional Analysis in a Population-based Cohort: https://academic.oup.com/jn/article/149/4/642/5420415 Nutrition Management of Children with Attention Deficit Hyperactivity Disorder: https://journals.sagepub.com/doi/full/10.1177/1941406414551202  Feeling Stressed at Work? B Vitamins Might Come to Your Rescue Mankind is engulfed by stress existing as a result of our different actions, thoughts and deeds. Even kids and adolescents are swarmed by loads of homework or class projects that need their undivided attention most of the times; both the couples work equally hard to pull through the month which leaves the kids at the mercy of daycare and the unending rise in commodity prices has left us all agape with many families trying to end their lives unable to match their salary with the daily life requirements. Choices are many but so are the consequences of advancements. Stress at workplace is becoming even more troublesome than before and individuals sought for retirement as early as their early 50s unable to bear workplace stress. Such stress-related problems in workplace are present globally, costs every country’s economy millions of dollars annually and its effect is wide-spread at the occupational, personal and societal levels.
Occupational stress has the ability to affect our quality of life at every level-it prevents us from delivering excellent work or meet demands at workplace, increases the number of leaves taken, productivity is lost and the expenses incurred due to mental and physical health issues are costly. But when we analyze the underlying cause behind such occupational stress in the first place, it is primarily due to the inability of the individual to carry out the overwhelming demands of the workplace. When there is overpouring work, the individual loses his/her ability to deal with stress and this is further aggravated by poor diet routines that once again decrease our body’s ability to deal with stress. Food has always played an integral role in affecting the quality of life of individuals as it has the ability to improve cognitive skills and decrease negative moods such as depression, anxiety and stress. While different foods prove to be advantageous in different ways vitamins and minerals, especially B vitamins are great against diseases and disabilities. B vitamins play an essential role in various cortical processes involved in metabolism such as in the methylation of homocysteine to methionine that’s absolutely necessary for DNA synthesis, repair and other methylation reactions in the central nervous system. When this methylation process is disrupted it increases the likelihood of inflammation, oxidative stress and damage to mitochondria and DNA strands. Studies Related to Vitamin B Supplements Acting Against Stress The world now runs on medicines and supplements to pull us through everyday hurdles. Right from small kids to elderly people most of the individuals worldwide rely on supplements for strength and vitality as we all follow haphazard lifestyle practices and irregular eating patterns that’s hard on our body. Despite the widespread consumption of these vitamins and supplements we don’t have many clinical trials or research conducted analyzing the impact of these multivitamins on psychological strain. 2 studies observed reduction in stress levels after multivitamin supplements were given for 28 and 30 days. In one study, Schlebusch and colleagues used a well-designed protocol and screened for a highly stressed sample which after a duration of 30 days reduced stress and improved well-being. Another research team, Carroll and colleagues employed 80 male participants who were supplemented over 28 days and results showed that these participants witnessed reduction in stress levels compared to the placebo group. There are numerous advertisements shown for various supplements but their impact on human health is not proved without doubt. A research team analyzed whether a multivitamin supplement available in Australia that mainly consisted of B vitamins was helpful in improving work related stress after administering it for 90 days. 60 participants were recruited for the study and all of them completed a 3-month, double-blind, randomized, placebo-controlled trial in which each of the individual’s mood, anxiety, demands and strain were assessed. Results showed that the intervention group experienced significant reduction in personal strain from weeks 4 to 12 while the placebo group experienced an increase in strain from weeks 4 to 12. A double-blind, randomized, placebo-controlled Australian study tried to understand the relationship between B-vitamin supplementation, workplace stress and mood measures and also wanted to analyze whether dispensing vitamin B supplements for around 6 months had the ability to improve stress-related problems in healthy, working individuals. The study group’s secondary aim was to examine the mechanisms underpinning any mood or workplace stress enhancing actions of B vitamins by looking at the relationship between cognitive, biological and cardiovascular variables over these 6 months. The team chose 200 full-time participants who were aged between 30 and 65 years and reported feeling stressed in the workplace. The team excluded those individuals who suffered from psychiatric or neurological disorders, disorders affecting food metabolism, had diabetes, consumed alcohol regularly, suffered vision problems or suffered from chronic diseases. They also ruled out those participants who were pregnant, breastfeeding or planning to become pregnant, were taking anticoagulation meds or psychoactive meds that included antidepressants, antipsychotics, anxiolytics, illicit drugs or significant cognitive enhancing drugs. All the participants were asked to fill five online questionnaires and were screened over the telephone for their eligibility in participating in the study. Blood samples were collected and all of them were given a light breakfast before completing a cognitive test battery. All of them underwent two testing sessions at the end of which each of them were provided with supplements that could last for as much as 6 months. All the participants were asked to comment on their mood, stress levels and general health from the first to fifth month post randomization and during their second visit at the end of study period all of them were asked to return any unused supplements, if any. Primary outcomes measured include the effect of supplements on work-related stress while secondary outcomes include measuring cognitive stress, mood, health, personality, cardiovascular, biochemical, genetic and neuroimaging measures. Stress was assessed with the help of numerous self-reported questionnaires that will be used to assess stress, mood and general health. Stress symptoms were analyzed using a perceived stress scale (PSS), depression and anxiety was measured using the Beck Depressive Inventory II (BDI-II) and the Spielberger State-Trait Anxiety Inventory respectively. Dietary habits were inferred using a food frequency questionnaire. Results Separate mixed linear models were conducted to test the effects of treatment group (active vs. placebo) and time (baseline vs. 6 months) on blood plasma concentrations of homocysteine, vitamin B6, vitamin B12 and red blood cell folate. The treatment group had significant vitamin B6 and B12 concentrations indicating that the biomarker levels increased after treatment. There was a significant group by time interaction for plasma homocysteine concentration with the treatment group resulting in significantly reduced homocysteine but folate levels did not change as a result of treatment. The treatment also led to an increase in PCC (NAA, choline and creatine) concentrations. The study showed that 6 months intervention with B vitamin supplements increased plasma vitamin B6 and B12 levels and reduced blood plasma homocysteine levels. Vitamin B6 levels were associated with increased choline and creatine whereas increased B12 levels were linked to increased creatine concentrations. All these provide a green signal for the use of B vitamin supplements in reducing inflammation and oxidative stress and promoting neural metabolic processes. This is the first study to show the efficiency of high-dose B vitamin multivitamin supplementation in modulating the relationship between neural and blood biomarkers of oxidative stress. The supplementation helped in reducing the blood markers for oxidative stress and increasing the brain markers for oxidative metabolism and myelination. B vitamins definitely play an integral role in regulating brain health, keeping us from getting stressed and alleviating diseases and disability. A meta-analysis of eight studies that focused on the effect of multivitamins on mood and psychological state found that supplementing individuals with B vitamins reduced perceived stress, mild psychiatric symptoms and anxiety. References Reducing Occupational Stress with a B-vitamin Focused Intervention: A Randomized Clinical Trial: https://nutritionj.biomedcentral.com/articles/10.1186/1475-2891-13-122 The Effect of a High-Dose Vitamin B Supplement on the Relationship between Brain Metabolism & Blood Biomarkers of Oxidative Stress: https://www.ncbi.nlm.nih.gov/pmc/articles/PMC6316433/ B Vitamins & the Brain: Mechanisms, Dose & Efficacy: https://www.ncbi.nlm.nih.gov/pmc/articles/PMC4772032/  There is a 2-way Connection between Diabetes & Periodontitis Diabetes doesn’t only prevent the patient from eating sweets and sugary foods but also destroys the core body part required for munching and chewing these foods-teeth! Diabetes rates have doubled or tripled in the last couple of decades everywhere around the world affecting not only the patient’s quality of life but also putting him/her at an elevated risk of multiple complications such as neuropathy, eye damage, skin disease, cardiovascular disease and periodontal disease. Periodontitis (a chronic inflammation disease of the mouth that involves the gingiva (gum tissues), teeth and supporting bone) has been identified as the sixth complication of diabetes and the sixth most common disease globally.
Periodontitis This is one of the most common diseases prevalent among humans. Though the progression of the disease is quite slow the tissue destruction that happens is largely irreversible. The disease is not painful during the initial stages which makes the person vulnerable to teeth damage and the patient recognizes the presence only after the condition had progressed enough to affect tooth mobility. In the early stages known as gingivitis the gums become swollen, red and might bleed whereas in the serious form called as periodontitis the gums might even pull out of the tooth, bone might be lost and the teeth might loosen and even fall away. While diabetes exists as a risk factor for periodontitis the presence of it increases the risk of stroke, myocardial infarction, atherosclerosis and hypertension. It can even cause delayed memory and calculation abilities in patients over the age of 60 and above. Those individuals with elevated blood glucose levels and diabetes mellitus display higher degrees of periodontal inflammation which often prove difficult to manage glucose levels due to persistent inflammation. It’s been proclaimed that diabetes exacerbates the onset, progression and severity of periodontitis. The intensity of the disease depends on how well the patient manages blood glucose levels. Diabetes patients have compromised immunity that puts them at a higher risk of infections, display decreased healing power and are at an increased risk of problems with the kidneys, eyes and heart-all these puts the person at a higher risk of periodontal disease. Such poor defence strategy can lead to higher risk of tooth loss in diabetes patients. Various studies help us understand the close-knit link between diabetes and periodontal disease in a better way. Retrospective Study The study below focused on 100 individuals (inclusion criteria included that the participants were above the age of 20 and suffered from diabetes) of which 50 of them suffered from diabetes and the rest were taken as the control group. India is one of the top countries with leading number of diabetes cases-while only 2.1% people suffered from diabetes mellitus in 1970s the rate has now risen to 12.1% which has a huge impact. The World Health Organization (WHO) has given a warning that India would become the ‘Diabetes Mellitus Capital of the World’ if we continue at this present rate. The present study shows that there is a significant difference in tooth loss among diabetics and non-diabetics. In another study done by Ogunbodede et al the female:male ratio was proved showing that females are the greater affected lot compared to males. Another study done by Chineye et al showed that male to female ratio in the diabetic subjects was 2:1. Some other studies showed male to female ratios as 1:1. A study done by Ochao et al at Columbia showed that there were 47.4% diabetic subjects who had a greater number of missing teeth and also suffered from gingival disease in the past. Periodontitis & Diabetes Can Affect Each Other Risk of periodontitis is almost 3-times greater in diabetics compared to others and the degree of the disease depends on the amount of blood sugar levels in the body. The US National Health & Nutrition Examination Survey (NHANES) III showed that adults with >9% Hb1A1C levels had higher prevalence of severe periodontitis compared to those without diabetes. There have been a number of case-controlled studies and all of them show that the risk of periodontitis is three-folds more in the Pima Indian population who suffered from diabetes mellitus compared to those who did not. Type 2 diabetes was considered to be the culprit for periodontitis but a couple of studies showed that type 1 diabetes also is an equal risk factor for the disease. One of the studies even proved that around 10% of kids (<18 years) with type 1 diabetes had profound bone and teeth loss compared to controls and another study on 350 diabetic kids aged 6-18 years and 350 non-diabetic kids showed that occurrence of periodontitis was greater in children with diabetes (20%) compared to controls (8%). Of late, we have emerging evidences that the link between diabetes and periodontitis is like a two-way channel-not only diabetes is a risk factor for periodontitis but also periodontal disease is a risk factor for diabetes. The Gila River Indian community was the first classic example to support the two-way theory. It showed that sever periodontitis was linked to a 9% increase in diabetes risk. The study also probed into the effect of periodontitis on overt nephropathy on 529 individuals aged ≥25 years who suffered from type 2 diabetes mellitus but no macroalbuminuria. It was seen that the incidence of macroalbuminuria was 2.0, 2.1 and 2.6 times higher compared to those with moderate or severe periodontitis. A 7-year prospective study on 5,848 diabetes-free individuals aged 30-59 years analysed the impact of periodontitis on diabetes incidence rates. Results showed that moderate-severe periodontitis increased the risk of diabetes incidence but the significance of it was lost after adjusting for sex, BMI, smoking, BMI, hypertension and HDL cholesterol. Another 5-year study looked into the effect of periodontitis on changes in HbA1C levels on 2,973 non-diabetic individuals. Results showed that participants with advanced periodontits at baseline showed 5-times greater increase in HbA1C levels over the 5 years compared to those with no periodontitis at baseline. This was the first study to show increase in HbA1C levels in those individuals who showed no signs of diabetes but only because they suffered from periodontitis. Such individuals who suffer from both diabetes and periodontitis are at a higher risk of cardiorenal mortality compared to those without severe periodontitis. A recent study looked at a 40-year trend of diabetes and periodontal disease collecting data from nine waves of National Health and Nutrition Examination Survey conducted from 1971 to 2012. 37,609 participants aged >25 years were involved and results showed that tooth loss was associated with diabetes. Both Diseases Have Inflammation as their Common Ground Periodontitis is a chronic inflammatory disease while both type 1 and type 2 diabetes increase systemic markers of inflammation. Elevated serum levels of IL-6 and TNF-α are seen in diabetes and the same is also seen in those affected by periodontitis. Such inflammation that’s linked with periodontal disease might also increase diabetes risk. Diabetes was consistently higher among Hispanic blacks and Mexican Americans than among non-Hispanic whites and the number of tooth lost after the age of 60 was higher among these three ethnic groups. The oral cavity has a diverse range of microbiota. Generally, the bacterial infection in periodontitis does not differ between nondiabetic and type 2 diabetes patients but there is a difference in the way the immune system responds. A study on 282 subjects (9% of them had type 2 diabetes) with similar severity of periodontitis showed that patients with type 2 diabetes might have fewer bacteria in periodontal pockets but with the same severity of the disease. The inflammatory response to infection in those suffering from type 2 diabetes is more compared to non-diabetic subjects. The accumulation of advanced glycation end-products (AGEs) in the periodontal tissues can also instigate periodontal inflammation in individuals with diabetes. AGE binds to its receptor (RAGE) producing inflammation mediators such as interleukin-6 and TNF- α. AGE increases oxidant stress, enhances respiratory burst in PMNs, has devastating effect on bone metabolism and alters lipid mechanism. Periodontal Treatment Improves Diabetes Levels There are various studies supporting the fact that periodontal intervention has positive effects on blood glucose levels. A combined report on 10 intervention studies on 456 patients showed a 0.66% decrease in HbA1C as a result of periodontal therapy. Another meta-analysis involving nine studies in 2008 showed 0.46% reduction in Hb1AC after treatment for periodontitis. A meta-analysis of 5 studies in 2010 involving 371 patients reported a reduction in Hb1AC of .40%. It was seen that in patients with A1C levels > 9.0% periodontal therapy reduced A1C by 0.6% in the absence of changes in medication and by 1.4% when diabetes medications are introduced. Though the logic behind reduction in glycemic levels post periodontal treatment is not clear researchers believe that it is due to reduced systemic inflammation. Reduction in Hb1AC levels greatly reduce the risk of diabetes complications-each 1% reduction in Hb1AC is associated with reduction in risk of 21% for any endpoint related to diabetes, 21% for deaths related to diabetes, 14% for myocardial infarction and 37% for microvascular complications. Diabetes is a significant risk factor for periodontitis and controlling diabetes controls the risk of periodontitis. The importance of oral health must be promoted in people with diabetes to avoid the consequences of tooth loss later. Many people remain unaware of the relationship between periodontitis and diabetes. Healthcare providers should check on a diabetes patient’s dental health and also suggest that the individual maintains oral hygiene to escape from the clutches of periodontitis and other dental health problems. References Prevalence of Periodontal Disease and Tooth Loss in Patients Suffering from Diabetes: http://www.medicalsciencejournal.com/archives/2019/vol5/issue1/5-1-94 Diabetes & Periodontal Disease: An Update for Healthcare Providers: https://spectrum.diabetesjournals.org/content/24/4/195 Periodontitis & Diabetes: A Two-way Relationship: https://www.ncbi.nlm.nih.gov/pmc/articles/PMC3228943/ Diabetes Linked to Increased Risk of Tooth Loss: http://www.diabetesincontrol.com/diabetes-linked-to-tooth-loss/ The Burden of Diabetes, its Oral Complications & Their Prevention & Management: https://www.ncbi.nlm.nih.gov/pmc/articles/PMC6108795/#ref81  Moms Usually can Tell the Slightest of a Change in their Neonate’s Health Man is addicted to habits and a slight change in his/her daily routine frustrates and puts him/her at unease. Think about a baby who lives inside his/her mother’s womb for nine whole months and comes unto this world full of hopes and surprises! There would be a change in temperature, environment and what not-being brought into this world, the newborn is now faced with the challenges of accommodating from intra-uterine to extra-uterine. According to the World Health Organization (WHO) the early newborn period is most critical for survival of a neonate (the period right from birth up to 28 days of age) and the child is probably at the highest risk of death during this period in a world where close to 10 million deaths occur every year in kids younger than 5 years old. Almost two-thirds of such deaths happen in the neonatal period where one-third of them happen during the first day of life of the neonate, almost half within 3 days and nearly three-quarters within first week of life. Developing countries contribute to a majority of such deaths with almost 34 of every 1000 live births leading to death and our country has seen a steady decline in the number of neonatal deaths from around 53 to only 22-28 per 1000 live births. Sub-Saharan Africa ranks highest in such deaths where the child’s day of birth is also its day of death unfortunately.
Death doesn’t occur all of a sudden mostly and there are multiple clinical signs that lead to the fatality. Fever is a common manifestation of diseases and requires immediate medical attention. Other signs include lethargy, poor sucking, increased respiratory rate (more than 60 beats per min), chest retractions and convulsions (sudden, abnormal electrical activity in the brain). Hence, the first 28 days are like a test to the child’s survival-it is of utmost importance to provide the best of feeding and care to maximize the neonate’s chances of survival and a healthy existence in this world. Developed by UNICEF and WHO the Integrated Management of Childhood Illness (IMCI) approach is understanding the various underlying causes of illness. This recognition of danger signs by the parent or any other caretaker helps in getting medical attention as early as possible. The reason why there is so much insistence is because a majority of neonatal deaths occur at home in which almost 75% can be prevented if there was timely action taken, the signs of an illness recognized by the parent/caretaker and there was no delay in the choice to go for medical action. Here, in this article we would be looking at the parent’s knowledge about the kid’s health, changes in health and the capacity to seek medical help in countries around the world. Knowledge of Mothers Regarding their Neonate’s Health Status in Ethiopia As per 2016 records, under-5 mortality rates were 67 deaths per 1,000 live births and most neonatal deaths occur at home showing that still most are unable to recognize and give treatment at the right time. Most children die due to lack of knowledge of the parent and the research here assesses the mother’s knowledge on neonatal danger signs and the reasons behind such poor knowledge for being unable to save her dying neonate! 368 mothers were selected to participate in the study of which 355 of them completed the interview. Mean age of the participants was 27.7, almost 60% of them were housewives and 234 (65.9%) of them gave birth at health institutions. It was reported that of the 355 participants, 281 (79.2%) of them had information about neonatal danger sign of which diarrhea (160 were aware), fever (136) and persistent vomiting (127) were more familiar with the participants. It was seen that 68.68% moms had good knowledge about neonatal danger signs-they were familiar with three or more signs of danger. When asked about the place of care 78 mothers (33.8%) opted for home care of their sick neonate, 82 (32%) wanted to take them to health institutions, 56 (24.2%) wanted to take them to traditional healers and 15 (6.5%) did nothing. Home care was basically garlic, tenadam, a mix of lemon and ash applied on the neonate’s head for tonsils, matchstick for convulsion, tepid sponging for fever, sunlight exposure for jaundice and using coconut oil to rub all over the body for cold body. 118 mothers continued to breastfeed despite the presence of disease but 113 of them did not. The factors associated with the mom’s knowledge include the mom’s educational status, income, place of birth and source of information. Moms who gave birth in a health institution were 6.45 times likelier to take their neonates back to the institution and those who received a post-natal care (PNC) follow were 6.19 times likelier to go back to the hospital for a follow up. It was also seen that husband’s education status, husband occupation status, place of birth and PNC had a significant effect on the maternal practice for neonatal danger signs. The study clearly showed that educational qualification and work status clearly dominated the list of attributes that motivated women to seek the help of a health institution. Another study in Ethiopia on 400 mothers/caregivers had a response rate of 94.7% and the participants’ mean age was between 25 and 34 years. Almost 64% were illiterate mothers with only 7.5% completing secondary education. Almost 40% infants were between 9 and 24 weeks of age, 32% were between 8 and 16 weeks of age and only 5.5% were aged less than one week during the study period. 67.5% infants were delivered at the hospital and only 6.6% of them were delivered at home. Of the study group almost 92.8% of them reported that they take their children to the health care center and among the rest who don’t almost 34% reported high treatment cost followed by lack of money (30%) as the reason behind it. When the study group tried to categorize the mother’s knowledge about their neonate’s risk as adequate and inadequate it was observed that almost two-thirds (65.3%) of them had inadequate knowledge as they were not even able to identify more than three symptoms among the 13 symptoms of illness of newborns and young infants. Knowledge of Mothers Regarding their Neonate’s Health in India Neonatal mortality rates (NMR) have dropped significantly in our country with Uttarakhand having a minimum of 11 and Haridwar having maximum NMR of 50. In Dehradun, neonatal mortality rate is 32 per 1000 live births. The survival of the child depends on the mother’s health alongside her knowledge and skills as a mom is the ‘one’ person who has constant contact with the child monitoring his/her actions and health. The baby is said to be in danger when any of the following signs are experienced: movement only when stimulated, temperature below 35.5 °C and above 37.5 °C, respiratory rate over 60 breaths per minute, history of convulsions and history of feeding difficulty. The study conducted in Dehradun included 100 mothers for sampling but only 53 of them reported neonatal danger signs and were monitored for their observation and handling practices. Results showed that:
Knowledge of Mothers Regarding their Neonate’s Health in Saudi Arabia Infant mortality rate in Saudi Arabia is pretty low-11 deaths per 1000 live births as per 2015 results. Under-five mortality rates in this country has reached Millennium Development Goal-4 target still infant mortality rates remains higher compared to many other countries. A community-based study was conducted in Riyadh city of this country regarding a mother’s knowledge about WHO guidelines on neonate danger signs. Primary health care centers (PHCC) are located all over the city and they provide free care to most of the residents there. Sample data of all the mothers who delivered a baby or nursed a baby (as in the case of caregivers such as grandmothers, grandfathers, fathers or nannies) in the past two years were taken from these health care centers. Face to face interviews were conducted with the mothers-the mother’s knowledge and her response on the neonate’s danger signs was collected, all the participants were asked to list the signs that they found threatening to the neonate’s life, recall any signs of danger that they personally experienced with the neonate, the time from noticing any danger to presenting it at the health facility, care received at the society and outcome of the neonate’s illness. A total of 1428 women who were in the age group of 20-60 years were included in the study. 98% neonates were cared by their mothers, 33% had education up to degree level and 37% had secondary education. 87% women had attended antenatal care and 45% had 4 or more children. Results showed that:
Research Mother’s Knowledge & Practice about Neonatal Danger Signs & Associated Factors: http://www.jbiomeds.com/biomedical-sciences/mothers-knowledge-and-practice-about-neonatal-danger-signs-and-associatedfactors-in-wolkite-town-gurage-zone-snnpr-ethiopia-2017.php?aid=21314 Neonatal Danger Signs: Attitude & Practice of Post-natal Mothers: https://www.omicsonline.org/open-access/neonatal-danger-signs-attitude-and-practice-of-postnatal-mothers-2167-1168-1000401.php?aid=89908 Mother’s & Caregiver’s Knowledge on Neonate’s Danger Signs: https://www.hindawi.com/journals/bmri/2019/1750240/ Parents’ Knowledge of Danger Signs & Health Seeking Behavior in Newborn & Young Infant Illness in Southwest Ethiopia: https://www.ncbi.nlm.nih.gov/pmc/articles/PMC6308740/  Depression & Metabolic Syndrome are Definitely Linked to Each Other Metabolic syndrome (MetS) is a cluster of metabolic disorders that increase the risk of cardiovascular disease when present in combination with each other. The disorders that elevate the risk include hypertension, central obesity, glucose intolerance and serum lipid disorders. While these conditions are good enough to put the individual in a high-risk category for heart problems there is a greater chance that the individual could suffer from cardiovascular issues when they occur in together. There has been an increasing concern regarding MetS as more than 23% of the adult population seems to be affected making them susceptible to diabetes, cardiovascular disease, stroke and diseases related to fatty build-up in artery walls. So, when we look at the risk factors behind this disease its none other than obesity, overweight, physical inactivity, genetic factors and ageing.
Its been found that certain MetS features such as excessive adiposity, dyslipidaemia and glucose intolerance are strongly associated with depression-a health condition that now exists as the fourth biggest cause of disease burden in the world. Women are the primary victims of this condition though these days increasing number of men silently suffer from its effects. Depression involves change in mood and cognitive function besides being linked to a proinflammatory process that increases the risk of being affected by cardiovascular disease. There is a widespread prevalence of an activated peripheral immune system in these adults with overproduction of proinflammatory cytokine that has the potential to increase the risk of depressive symptoms. As it is now evident that both MetS and depression are commonly present bearing increased public health implications there has been interests shown in finding out an association between them. Depression involves dysregulation of the adrenocortical and autonomic nervous systems both of which increase the risk of MetS by supporting abdominal fat accumulation and insulin resistance. MetS is generally linked to increased levels of inflammatory cytokines and leptin resistance and c-reactive protein (CRP) is one of the commonly present inflammatory markers in subjects with MetS. Health experts have come up with various proposals for controlling MetS occurrence the most common of which includes lifestyle changes (that includes diet modifications and exercises) and drug therapy. The Mediterranean diet has been generally prescribed as the best weight loss approach that’s beneficial for both MetS and depression. But we do have questions arising on how weight loss can have a positive effect on the mind in terms of reducing symptoms of depression. The study below exactly deals with this concern-it uses a subsample of the RESMENA-S study that tries to reduce MetS using a hypocaloric diet for a period of six months. It was generally assumed that the this diet does have a positive effect on depressive symptoms as well and the research team tried to understand the process through which it happens. RESMENA-S Study The study included 93 subjects (52 men and 41 women) aged around 50 years with a BMI around 36 kg/m2 diagnosed with MetS. Six months after following the hypocaloric diet 26 participants were eliminated due to different reasons and 7 of the 67 participants who did complete the study did not finish the Beck Depression Inventories (BDI) and hence, the study was left with not more than 60 participants who were able to complete the BDI in three visits (at baseline, after two months and end of six months). All the participants were put into either of the two groups randomly-control group or the RESMENA diet. All the participants were requested to carry on with their regular physical activity schedules and their performance was measured using a 24-hour physical activity questionnaire at the beginning and end of study. The research team measured serum glucose, total cholesterol, HDL-cholesterol, triglycerides and free fatty acids serum concentration. Depression symptoms were analysed thrice over the course of the study (at baseline, after two months and at the end of the study) using a Spanish version of the BDI. A score of ≥10 reflects moderate depressive symptoms. Results Results showed that:
References A Decline in Inflammation is Associated with Less Depressive Symptoms after a Dietary Intervention in Metabolic Syndrome Patients: https://nutritionj.biomedcentral.com/articles/10.1186/1475-2891-13-36 Systematic Inflammation is Associated with Depressive Symptoms Differentially by Sex and Race: A Longitudinal Study of Urban Adults: https://www.nature.com/articles/s41380-019-0408-2  Antenatal Depression Ruins a Woman’s Happiness during the Period Postnatal depression was the only type of depression known to the world two decades back and those women suffering from antenatal depression were simply told that it’s just their hormone calling for attention. It’s been observed that 1 in every 10 women will be depressed at any point of time during pregnancy while 1 of every 30 women will be depressed during pregnancy and after delivery. Pregnancy, as we all know, is the most joyous period in a woman’s life as the pregnant woman experiences the peak of womanhood looking forward to the birth of her loving child. But according to some pregnant women who experience prenatal depression, the same pregnancy term instead of being filled with happiness and excitement turns out into a period of despair and gloom. There are various causes including physical, emotional and hormonal effects that can raises the risk of prenatal depression but this has dangerous consequences on the newborn, child and adult health outcomes putting the individual at a higher risk of common disorders.
Disasters of Depression in Pregnant Women Depression as such is one of the highly common mental disorders that’s 50% more common in women than men. Almost 10-15% of women in developed countries and 20-40% of women in developing countries experience depression during pregnancy or after childbirth. Such depressions in pregnant women could have debilitating health outcomes when it is not stopped at the right time. Beyond affecting the immediate family, it also affects the society. Pregnancy is the period during which the woman undergoes numerous hormonal changes, her nutrient requirements vary and the mind goes through a sea of conflicting emotions simultaneously. We often hear elderly people advice the pregnant lady to eat for two as she is carrying another human inside but dietary guidelines don’t support this. Still, nutrient requirements increase to meet the needs of the developing fetus and the mother as well and fulfilling these requirements prepares the woman for a healthy delivery and a healthy baby thereafter. But depression brings about changes in her nutrient intakes which finally affects the health of the baby and the mother. Generally, these women eat fewer macronutrients (with the exception of fats), their nutrient levels are lower (with the exception of phosphorus) than recommendations and there are also theories that while these women have sufficient intake of macronutrients they witness a decrease in micronutrient intake. Often we see people eating according to their mood. We indulge in sweets when we are happy or even refrain from eating when we are sad. Some people cope up with sorrows in life by eating tubs of cheesy fries and it has been shown that mental health of women affects their nutritional intake and also impacts the fetus. Depressed women are at an increased risk of giving birth to neonates with low birth weight (LBW) (this is a leading cause of neonate mortality and morbidity), preterm birth or with an Apgar score of 1-5 some five minutes after birth. Women around the world suffer from antenatal depression with each of them experiencing different outcomes. A Study on Antenatal Depression in Pakistani Pregnant Women Pakistan has a maternal mortality rate of 260 for every 1,00,000 live births with almost 18-80% pregnant women suffering from antenatal depression. The study aimed at measuring association of depression with maternal dietary intake and neonate outcomes. Participants were pregnant women aged between 18 and 49 years at the start of their second trimester and having normal nutrient intakes. The study group ensured that those with depression, chronic diseases such as diabetes, anemia, BP and CHD or belonging to the high-risk pregnancy category were excluded from the study. Information about the participants such as demography, husband’s employment, gestational age and expected delivery date was collected using questionnaires. The Edinburgh Postnatal Depression Scale (EPDS) was used to measure the participant’s state of mind. Of the 94 participants who were cleared for the study 12 of them were excluded following no-show during follow up and finally the study was carried out with a sample size of 82. An EPDS score of 9 indicated absence of depression, a score of 9-12 indicated moderate depression and a score of more than 13 indicated severe depression. Maternal intake was noted using a 24-hour dietary recall and a Food Frequency checklist at the start of the study and the same was repeated at the 36th week of gestation to analyze poor maternal nutrient intake. Food items were classified and their frequency of consumption (between never and 6+ times in a week) was noted. Each of the participants were questioned on their methods of preparation, portion sizes consumed and the types of snacks eaten. The 24-hour dietary recall was used to calculate macronutrient intake. The Healthy Eating Index (HEI) was used to score the 24 h recall with the overall score being reduced to 50 with the score split based on the type of food consumed-total fruit (5 score), whole fruit (5 score), total vegetables (5 score), greens and beans (5 score), whole grain (10 score), dairy (10 score), total protein foods (5 score) and seafood and plant proteins (5 score). Following dietary guidelines protocol to the dot yielded full score, a score ≥40 indicated good diet, a score between 25 and 40 was rated as moderate and a score below 25 was considered poor diet. Cut off points for carbohydrate and protein intake were ≥175 g and ≥71 g while it was ≥55 g for fats. Height, weight and BMI measurements of all the participants were taken and each of them was classified as underweight, normal weight, overweight or obese based on WHO guidelines. Information on the newborn was acquired in the form of fetal growth retardation (FGR), low (score of 6 or less) Apgar score and low birth weight (LBW) scores (<2500 g). Result While mean age of the participants was 29 years almost 51% of them were between 24-29 years and 66% of them were between 151 and 160 cm. Mean weight of moms was 70 kg and BMI was 26.6. Results showed that there was a mean difference of only one HEI between depressed and non-depressed women as depressed antenatal women were consuming 151 kcal lesser than non-depressed women at the start. But at the end of the study, there was a difference of 5 HEI between depressed and non-depressed antenatal women. Depressed women ate almost 321 kcal lesser than non-depressed women by the end of cohort. At baseline, the type and quantity of foods consumed by both categories (depressed and non-depressed) of women were almost similar. While consumption of cereal, beans and lentils remained almost constant even after succumbing to antenatal depression usage of eggs decreased drastically (by almost 43% initially up to 75% later). Though 85% women were drinking milk at the start of the study it dropped to 65% later. Similar changes were seen in fruits and vegetables intake too. 60% of depressed antenatal women consumed one serving of fruit at baseline but the figures decreased to 37% by the end of cohort. Sadly, none of them were having green leafy vegetables even once a week. It was seen that almost 62% of poor dietary intake was due to antenatal depression. Protein and fat intake in antenatal depressed women decreased to less than 71g and 55g at the end of cohort. Mean gestational age (born 2 days earlier), weight (200 g less) and low (0.5lower) Apgar score were low among neonates of depressed antenatal women compared to non-depressed women. FGR, preterm birth and poor Apgar score was predominantly seen among neonates of depressed antenatal women but not LBW and in this, 60% of FGR and poor Apgar score and 54% of preterm births could be attributed to antenatal depression. The study clearly reveals the impact of depression on the nutrient intake of pregnant women and dietary intake must be an important topic of discussion during nutrition counseling in the absence of which birth of a healthy baby and survival of a healthy mother both remain questionable. References Effect of Antenatal Depression on Maternal Dietary Intake & Neonatal Outcome: https://nutritionj.biomedcentral.com/articles/10.1186/s12937-016-0184-7 The Interplay between Maternal Nutrition and Stress during Pregnancy: https://www.karger.com/Article/PDF/457136  Yogurt is the Most-popular Fermented Dairy Food Worldwide  Choose your Favourite Fermented Dairy Food to Protect Your Body against CVD Risk Choose your Favourite Fermented Dairy Food to Protect Your Body against CVD Risk Do you remember the boy in the ad with a milk moustache? Then you are probably an 80s or 90s kid who has grown up seeing and hearing about the goodness of consuming dairy and its benefits on bone health-in those days dairy products were the magicians who could provide individuals with stronger bones and muscles. But today, the effects of dairy have been made dark and twisted with the food group being beneficial or harmful depending on the people’s intake and needs. While it might not be the best way to a healthy body dairy indeed is the simplest way to equip yourself with calcium, vitamin D and proteins to enable optimal functioning of the heart, muscles, bones and overall body. Kids are constantly forced to drink between 2 and 3 glasses of milk for sufficient calcium levels and one should also not forget the fact that bones become stronger only up to the age of 3 after which bone mass starts deteriorating. Hence, parents insist that their children consume dairy products like milk, cheese, yoghurt and cottage cheese for maintaining bone density and reducing risk of fracture. Fermented foods are the recent health craze and fermented dairy foods are no exception. Cheese and yoghurt are fermented foods that are a part of the Mediterranean diet, a diet that’s acclaimed for its protective nature against cardiovascular diseases (CVD). Dairy products have the capability to provide up to 60% of the recommended daily allowance (RDA) of calcium and fermented dairy products are an excellent source of vitamin K. We have studies showing that fermented dairy products show beneficial effects on blood lipid profiles and the risk of heart disease compared to regular dairy products as they deliver probiotics that benefit the gut microbiota. The human gut has been the centre of attraction these days as they seem to regulate whole body health. Still, there are not many research studies providing insightful data on the benefits of fermented dairy foods. Cardiovascular Benefits of Fermented Dairy Products on Australian Population Type 2 diabetes mellitus (T2DM) and CVD are spreading like forest fire worldwide and researchers are trying various means to curb their rise. Of late, there has been an increasing interest in the relationship between dairy consumption, specifically fermented dairy foods, and its effect on T2DM and CVD risk. We have meta-analysis from cohort studies showing that yogurt consumption has a positive effect on T2DM. Yet another meta-analysis of 29 cohort studies showed that consumption of fermented dairy products (such as milk products, cheese and yogurt) was inversely associated with CVD risk. There are not many studies that focus on middle-aged people as study participants and the Australian study discussed below examines the association between fermented dairy products and T2DM and CVD risk in Australian women. The Australian Longitudinal Study on Women’s Health (ALSWH) is a population-based cohort study examining the health and well-being of >58,000 Australian women. The current study included data from 1946-1951 age cohort and these women were surveyed every 2-3 years since the start of ALSWH in 1996. Information on dietary intake was first collected in survey 3 in 1991 and this was used as a baseline for the present study. Surveys 5-7 once again included dietary intake. After implementing various exclusion criteria, the study was left with 7633 participants in the T2DM subcohort and 7679 participants in the CVD subcohort. T2DM and CVD was self-reported and during every survey, women were asked whether they were diagnosed or treated for diabetes and coronary heart disease (CHD) in the past 3 years. In the present study, CVD was defined as the sum of CHD and stroke and incidence was defined as the onset of T2DM and CVD at surveys 4-8. Dietary intake was noted down with the help of a food frequency questionnaire (FFQ) that collected information on dairy consumption that included yogurt, cheese (different types of cheese such as hard cheese, soft cheese, firm cheese, ricotta or cottage cheese and low-fat cheese) and milk (including reduced-fat milk, skim milk, soya milk and flavoured milk). All the participants were asked to mark down their frequency of intake of dairy products over the last 12 months through the use of a 10-point scale (which has measurements from never to ≥3 times/d with the intake converted to grams per day) with milk being the only exception here whose intake quantity was reported between none and ≥750 ml/d. All the dairy products were classified as yogurt, total cheese (all types of cheese), total fermented dairy (sum of yogurt and total cheese), total nonfermented dairy (all types of milk) and total dairy (sum of total fermented dairy and nonfermented dairy). Women self-reported on height, weight and other body measurements; physical activity was calculated according to total metabolic equivalent (MET in min/wk) into ‘sedentary or low physical activity level’ (<600 MET min/wk), ‘moderate physical activity level’ (from 600 to <1200 min/wk) or ‘high physical activity level’ (≥1200 min/wk). BMI measurements were calculated and categorized as underweight (BMI <18.5), healthy weight (BMI from 18.5<25), overweight (BMI from 25-30) and obese (BMI ≥30). Results The mean age of 8748 women enrolled in the study was 52.5 years and mean BMI was 26.8. Women belonging to the highest tertile of energy-adjusted total dairy intake were likelier to have a lower BMI, were higher educated, never smoked, rarely drank and were physically active. Above all, they had a lower intake of total energy with median intakes corresponding to 20 g/d for yogurt, 14 g/d for total cheese, 35 g/d for total fermented dairy, 202 g/d for nonfermented dairy and 369 g/d for total dairy. 7633 were diabetes-free at baseline and were followed-up for ≤15 years. During follow-up 701 (9.2%) T2DM cases were reported. Results showed that:
Fermented Dairy Intake & CVD Disease Risk in Men Researchers at the University of Eastern Finland studied 2,000 men for their risk of CVD on consumption of fermented dairy products. All the participants’ dietary habits were assessed at the start of the study (1984-89) and followed up for around 20 years during which 472 of them experienced coronary heart disease event. All the participants were split into four groups depending on how much dairy (that is, fermented dairy products with less than 3.5% fat) they consumed and the researchers compared the groups with the highest and lowest consumption. Results showed that the incidence of coronary heart disease was 26% lower in the highest consumption group compared to the lowest consumption group, sour milk was the commonly used low-fat fermented dairy product and consumption of high-fat fermented dairy products such as cheese was not associated with coronary heart disease risk. On the other hand, increased consumption of non-fermented dairy products (such as milk whose intake was as high as 0.9 litre/day in some individuals) was associated with an increased risk of coronary heart disease. The practise of dairy consumption is changing all over the globe and in Finland (where this study happened) too people are moving away from the consumption of dairy products such as milk and sour milk to those fermented dairy products such as cheese, yogurt and others. Hence, men who eat plenty of fermented dairy products are at a reduced risk of CHD than men who eat less of these products. A study comparing fermented and non-fermented dairy products in a Swedish cohort found that there was a 32% increased hazard in consuming non-fermented milk compared to fermented milk. In another crossover-controlled study yoghurt consumption increased HDL levels in 29 hypocholesterolaemic women and we have other studies showing that fermented dairy intake has positive or neutral effects on fasting plasma glucose levels. Many studies revolve around the hypothesis that fermented dairy products induce cardioprotective effects due to the intake of bacterial metabolites and probiotics. Fermented dairy seems to be way better in every way compared to non-fermented dairy and individuals should take greater care to consume such products. References Total Fermented Dairy Food Intake is Inversely Associated with Cardiovascular Disease Risk in Women: https://academic.oup.com/jn/article/149/10/1797/5514556 Fermented Dairy Products May protect Against Heart Attack, Study Suggests: https://www.sciencedaily.com/releases/2018/10/181030102828.htm Dairy Fats and Cardiovascular Disease: Do We Really Need to be Concerned? https://www.ncbi.nlm.nih.gov/pmc/articles/PMC5867544/ Fermented Dairy Food & CVD Risk: https://pdfs.semanticscholar.org/336d/1c0782de6bcf3ee2056c0481119e088380a2.pdf 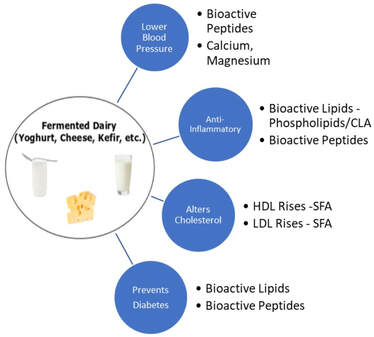 Don't Be Surprised When you Realize the Long List of Advantages of Consuming Fermented Dairy A Low-fat Diet During Menopause Causes Loss of Hope for Diabetes & Heart Disease to Take Over11/7/2019
 Fill Your Plate with Colorful Produce & Whole Grains to Reap Health Benefits Puberty and menopause bring in immense changes in a woman’s life which includes both physical and psychological. Her body undergoes staggering hormonal changes which in turn affect her body weight and food intake patterns too. Every girl needs immense care and comfort during her puberty years and every woman needs support and understanding nearing menopause. Ageing can increase body weight despite the individual eating the same number of calories as before. When menopause affects woman alongside ageing it causes double trouble-there are more chances of weight gain around the abdomen especially which pave way for an increased risk of diseases and health problems. Menopause is an indication that the ovaries make very little estrogen and such reduced estrogen levels increase the risk problems such as heart disease, stroke, osteoporosis and urinary incontinence in the years following menopause. Stringent dietary modifications and regular physical activity is recommended to avoid unnecessary weight gain changes in the absence of which overweight/obesity might be a common occurrence.
Diets low in saturated fats and cholesterol are associated with lower CVD rates and studies show that a Mediterranean-type dietary pattern (low-fat dietary pattern) prevented the occurrence of cardiovascular events. Women’s Health Initiative Dietary Modification Trial The main aim of the Women’s Health Initiative (WHI) Dietary Modification Trial was to understand whether a dietary pattern low in total fat alongside increase in the intake of vegetables, fruits and grains would decrease the risk of breast and colorectal cancer in postmenopausal women. The secondary aim was to note any link between such dietary intake and reduced risk of CVD. A total of 48,835 women aged between 50 and 79 years were enrolled between 1993 and 1998 in 40 US clinical centres and assigned to either the intervention group (40%) consisting of 19541 participants or the usual-diet comparison group (29,294 participants). While inclusion criteria stated being postmenopausal and consuming fat intake of 32% of total calories exclusion for WHI included prior occurrence of breast or colorectal cancer, medical conditions with survival rate less than 3 years and habits such as alcoholism. People with type 1 diabetes and those eating meals frequently away from home were also included in the exclusion list. All the participants were monitored for their total fat, vegetable, fruit and whole grain intake, they were supplemented with group activities and were also invited to participate in any one of the WHI controlled trials of hormone therapy (HT). Participation in a trial of calcium and vitamin D supplementation (CaD) was offered after one year. In total, 20,592 (42.2%) participated in the Dietary Modification Trial, 8050 (16.5%) in the Dietary Modification plus HT Trial, 25,210 (51.6%) in the Dietary Modification plus CaD Trial and 5017 (10.3%) in all 3 trials. All the participants were contacted bi-annually for changes in health outcomes while height, weight and BMI measurements were taken annually. Electrocardiograms (ECGs) were taken every 3 years, a medical update questionnaire was given every 6 months to fill and CHD, the outcome variable involved in the study was defined as acute myocardial infarction (MI) that required hospitalization. Adherence assumption included 13% lower consumption of fats in the intervention group compared to the control group one year from baseline decreasing further to 11% energy difference at 9 years. Results The participants’ mean age was 62.3 years, 3.4% reported instances of CVD. In comparison to the participants in the control group those in the intervention group reported significant changes in dietary components paving way for 8.2% lower mean total fat intake and 2.9% lower saturated fat intake which includes decreased intake of trans, mono- and polyunsaturated fat and cholesterol intake with increased consumption of fruits, vegetables, fibre, whole grains and soy. At the end of trial, 2404 women (4.9%) died, 1553 (3.2%) stopped follow-up and 527 (1.1%) were lost to follow-up. 5% in the intervention group and 4% in the control group withdrew, were lost to follow-up or stopped providing answers for more than 18 months during the study period. At 3 years of follow-up, women in the intervention group showed significant decrease in body weight, waist circumference diastolic blood pressure and LDL-C level but showed no effect on triglycerides and HDL-C levels, ratio of total cholesterol to HDL-C, levels of non-HDL-C, lipoprotein, glucose or insulin or insulin resistance as reported by homeostasis. Carotenoid levels that denotes increased vegetable consumption was significantly higher. After 8.1 years of follow-up, major CHD incidence levels were 30% lower in the intervention group compared to the control group. Dietary intervention did not bring in significant changes in major CHD or composite CHD rates. Neither total, fatal or nonfatal stroke were influenced by dietary intervention nor were composite measure of CVD. There seemed to be no influence on stroke levels even after 9 years of follow-up and only a nonsignificant trend towards decreased CHD rates in the intervention group in the later years. The WHI trial reduced fat intake by 8.2% at the end of 6 years while increasing vegetable and fruits servings by 1.1 and whole grain servings by 0.5. The trial decreased fat intake and increased produce intake modestly only and did not show any reduction in risk of CHD or stroke. Diabetes & Heart Disease Risk in Postmenopausal Women 83% participants in the WHI trial agreed for non-intervention follow-up and 86% of participants consented to an open-end follow-up. Analyses over the intervention and cumulative follow-up period identified significant intervention benefits related to breast cancer, CHD and diabetes. Cancer outcomes were coded the US National Cancer Institute’s SEER system throughout the intervention and postintervention phases. CHD was defined as nonfatal myocardial infarction plus CHD death. Total stroke was defined as ischemic plus haemorrhagic stroke. Total CVD was defined as CHD plus coronary artery bypass graft or percutaneous coronary intervention plus total stroke. Results showed that fat intake was lower by 11% in the intervention group, carbs intake higher by 10% and protein intake by almost 1%. Vegetable and fruits intake were higher by 1.2 servings to 5.1/d and grains was higher by ∼0.7 servings to 5.4/d in the intervention group. There was a significant reduction in breast cancer risk by 30% followed by death due to any cause. There was also a significant reduction in estrogen receptor positive, progesterone receptor negative and breast cancer incidence over the long-term follow-up. There were 13,498 deaths that happened during this period. A significant reduction in CHD rates happened among baseline normotensive participants while there was no effect seen on hypertensive participants. Total fat reduction in the follow-up of postmenopausal women showed that reduction in total fat was accompanied by increased vegetables, fruits and grains with increases in fiber and total carotenoid intakes. There were small but significant changes observed in blood pressure, LDL cholesterol, insulin, glucose, HOMA-IR and metabolic syndrome score that could help with CHD and diabetes risk. Replacing fats with carbs in a well-nourished population of postmenopausal women showed ∼24% of energy from fats compared with ∼35% in the comparison group, ∼58% of energy from carbohydrates compared with ∼48% in the comparison group and ∼18% compared with 17% of energy from proteins. While consumption of saturated and unsaturated fats decreased among participants the intervention group started eating more of fruits, vegetables, whole grains, micronutrients and fiber along with increase in sugars. Such dietary modifications proved beneficial for participants at a risk for CHD, diabetes and stroke. Hence, dietary changes decreased breast cancer risk by ∼35% during intervention and 15% over cumulative follow-up; reducing in CHD incidence by ∼30% during intervention and 15% over the cumulative follow-up among normotensive women and reduction in insulin-requiring diabetes by ∼25% during the intervention and 13% over cumulative follow-up. References Low-fat Dietary Pattern & Risk of Cardiovascular Disease: https://jamanetwork.com/journals/jama/fullarticle/202339 Low-fat Dietary Pattern Among Postmenopausal Women Influences Long-term Cancer, Cardiovascular Disease and Diabetes Outcomes: https://academic.oup.com/jn/article/149/9/1565/5512736 |
AVOID FRAUD. EAT SMART
Member - Academy Of Nutrition & Dietetics. USA
+91 7846 800 800 
|
- Home
- Written Testimonials
- Consult
- Clinics
- Blogs
-
Diet & Nutrition
- Diabetes Reversal
- IVF IUI not needed for PCOS PCOD Infertility
-
Medical Nutrition
>
-
Disease & Conditions
>
- Infertility | PCOS
- Diabetes Mellitus
- Cholesterol
- Hypothyroid
- Kidney Problems
- Hypertension
- Cardiovascular Diseases
- Liver Diseases
- Gastro intestinal disorder
- Cancer
- Metabolic Disorders
- Orthopedic Disorders
- Eating Disorders
- Dietary Recall
- Weight Record Filled By Clients
- Online Payment Transaction Details
- Online Clients Weight Check Form
- Our Program Package Service Charges
- Weight Record 2017 Clients
- Measurements sent by Clients
- Terms & Conditions Of Payment
- Thanks. Your Form is Submitted
- Video Testimonials
- Lifestyle & Wellness
- Lifestyle & Wellness Blog
- Allergy & Intolerance
- Weight Loss / Gain
- Weight Loss / Slimming Blog
-
Disease & Conditions
>
- Life Cycle Nutrition >
- Sports Nutrition >
- Integrity in Nutrition
- Knowledge Centre
© COPYRIGHT 2022. ALL RIGHTS RESERVED. FRST HEALTHCARE PVT LTD.
Dr. Nafeesa Imteyaz of First Eat Right clinic, is the Best Dietitian Nutritionist in Bangalore. Best Dietitian Nutritionist in Pune. Best Dietitian Nutritionist in Hyderabad. Best Dietitian Nutritionist in Chennai. Best Dietitian Nutritionist in Mumbai. Best Dietitian Nutritionist in Delhi. Best Dietitian Nutritionist in Kolkata.