|
Diabetes mellitus remains very famous and prevalent across the world. People are advised to take a blood sugar test every once a while to check for their glucose levels and ensure that it is well within normal limits. This is usually done in a laboratory where the technician gives you the results in quite some time. But if you are a diabetic person who suffers from vagaries in blood glucose levels often you might be used to carrying a self-monitoring blood glucose (SMBG) kit that requires you to prick your finger every time for blood samples for measurement. We don’t like to prick ourselves every now and then which restricts us from measuring the values to anywhere between 2 and 4 times a day. Diabetes is a disease in which the pancreas cannot create enough insulin (type 1) or the insulin created is not effective (type 2) and the patient suffers from high glucose levels that can cause an array of physiological damages such as kidney failure, skin ulcers or bleeding into the vitreous of the eye. When such high are the stakes of diabetes it is not possible to allow the user to measure his/her glucose levels only 2-4 times a day between which the patient could enter hypoglycemic or hyperglycemic condition that can cause dangerous side effects. So, apart from taking measurements only at certain times of the day the individual might remain unaware of the rise and falls in blood glucose levels while using conventional methods of measurement.
Apart from using SMBG for monitoring some diabetes patients use a continuous analyte sensor that measures the concentration of a specific analyte (in this case, its glucose) in the body and sends our raw signals that is shown as an output value in the display. This output value is expressed in a form that’s meaningful to the user, such as glucose expression in mg/dL. So, it now becomes a continuous glucose monitor (CGM) and some of these monitors cautions the user with alerts and messages when there is a deviation in glucose values going into hypoglycemia or hyperglycemia. Though this sounds useful, there are many times during which the user starts ignoring the alarm or goes into ‘alert fatigue’ thereby disregarding the alert or turning it off without thinking about the consequences. For instance, after meals these devices might send out high glucose alerts. The user is already aware of the fact that glucose levels increase post-meals and hence, they tend to ignore these alerts or even turn off the alert option. Such measures can cause the user to miss out on further important alerts that come their way when glucose levels rise! There are problems with ‘low alerts’ too as the user might set a higher low alert threshold such that they get ample time to prepare for a severe hypoglycemic event. This might trigger frequent alerts of low blood glucose levels that are actually not severe enough to cause an event. Though the user expects an alert for severe lows the higher frequency of the alerts can cause the user to mistrust the device. The systems and methods patented here comes as a welcome change to the other ones mentioned here as it corrects all the flaws of these systems and alerts the user only when it makes sense to do so. The systems and methods designed here alerts the user only after ensuring that the user is not already aware of their condition-such as when they are in a diabetic state that needs attention. The systems and methods alert the user when action is necessary such as a bolus or temporal base rate change but do not alert in times when there is no action required such as when the user is already aware of the rise in glucose levels or when a corrective action was already taken to keep it under control. Here, the alert system is optimized to provide fewer alarms than usually given when the system is unaware of the user’s cognitive awareness. The monitoring device might be a smart phone, a tablet computer, a smart watch or a dedicated monitoring device. The system predicts the cognitive awareness of the user by identifying whether the user has previously taken some action (such as eating a meal, consuming required medications or exercising) when there was a suspected risk of changes in blood sugar levels without any prompting or a clue. In order to alert the user, the system might include determining a clinical value of a glucose concentration to predict future diabetes state. When the user is not cognitively aware of the diabetic state needing attention, the system might alert the user with a user prompt after a certain delay not based on time but based on the emergency of the diabetic state needing attention. The systems and methods described here provide ways to incorporate ‘smart alerts’ in analyte monitoring systems especially in continuous glucose monitoring systems. Once an alert is given the user might be requested to comment on the usefulness of the alert with buttons such as ‘Thank You’ and ‘Go Away’. The response from the user can in turn be used to predict future alerts for example, if an alert was provided two hours after a meal but was considered by the user as not being helpful the next alert could be given 2.5 hours after the meal. The user can also help to improve data efficiency-for instance, when a user would be performing a heavy working session he/she would be aware that their glucose would be outside normal ranges. Hence, the user can activate a setting on their monitor maybe click a button on the smartphone to activate a special ‘work out’ alert schedule. The patent was published on Nov 2nd, 2017 and for more information on the patent please visit: United States Patent & Treaty Office: http://patft.uspto.gov/netacgi/nph-Parser?Sect1=PTO2&Sect2=HITOFF&p=1&u=%2Fnetahtml%2FPTO%2Fsearch-bool.html&r=4&f=G&l=50&co1=AND&d=PTXT&s1=%22alerts+optimized%22&s2=Dexcom&OS=%22alerts+optimized%22+AND+Dexcom&RS=%22alerts+optimized%22+AND+Dexcom European Patent Office: https://worldwide.espacenet.com/publicationDetails/biblio?II=0&ND=3&adjacent=true&locale=en_EP&FT=D&date=20181221&CC=CN&NR=109069073A&KC=A World Intellectual Property Organization: https://patentscope.wipo.int/search/en/detail.jsf?docId=US205407982&_cid=P20-JZXWZO-24775-1 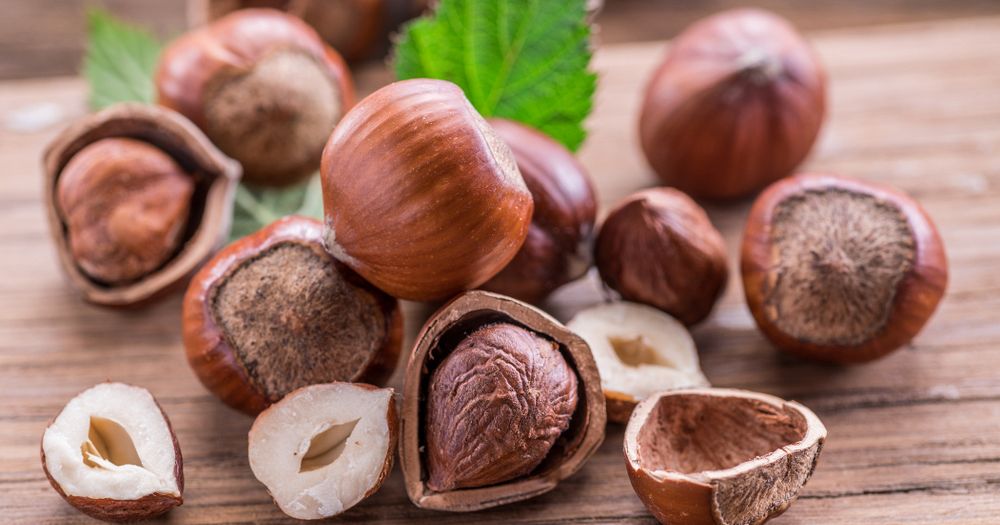 Hazelnut: It’s Not a Bigger Peanut but there’s More to its Nutritive Value Nuts have a rich history of being one of the healthiest and tastiest foods available for human consumption. Numerous debates exist regarding their high calorie values and there are conflicting views on their effect on weight loss but beyond all such misconceptions nuts have surely sought a place for themselves in the ‘good’ food list for their valuable ‘good’ fat content (unsaturated fat). Though nuts mostly remind us of our very own cashew nut, almonds, pistachios and walnuts the latest favorites are the hazelnuts (HNs). I’m sure most of you would be familiar with this nut if not for the nut as a standalone food but as an important addition in Nutella alongside chocolate. There are many of those who were introduced to the healthy Hazelnut through the calorie-rich Nutella which is a chocolate-hazelnut spread. A study about cashews or almonds might be a repeat but there are many of those who are unaware of the goodness of this delicious ‘Hazelnut’. Possible to Stay Unfazed by the Hazelnut? Nuts have been boasted of numerous health benefits right from reducing the risk of cardiovascular disease (CVD) to improving HDL (good) cholesterol levels. Hazelnut containing healthy fats, vitamin E, proteins and dietary fibers exists as the second most popular nut worldwide only next to almonds. Also known as filberts from European folklore the top three producers of this nut include Turkey, Italy and the United States of America. Almost 80% of hazelnut is comprised of monounsaturated fat with less than 4% composed of saturated fat. Any food that contains fat in such proportions helps in reducing total blood and ‘LDL’ cholesterol levels. While this makes HN a healthy snack it is used very frequently while manufacturing foods such as chocolate spread, nougat, cookie, cereal bar, pastry and ice creams. Apart from this, HN is also used as a prominent cooking oil or consumed raw, roasted, chopped, powered or processed into a praline paste. All the nuts have their own individuality and health benefits but hazelnut plays an extremely prominent role in promoting human nutrition as it has a combination of nutrients-macronutrients (lipids, fiber), micronutrients (minerals, vitamins), fat-soluble bioactives and phytochemicals (flavonoids). Let us look at each of the nutrients closely: Lipids & Fatty Acids Lipids form a greater part of the nut providing the kernel flavor that’s quite evident after roasting. This nutrient constitutes more than 60% of the kernel’s dry weight and is composed of 98% triacylglycerols (TAG). Oleic acid is the most prominent fatty acid present (76-82%) in the nut followed by linolenic acid, palmitic, stearic and vaccenic acid. HN also contains high levels of polyunsaturated fatty acids (PUFAs) and monounsaturated fatty acids (MUFAs) that are helpful in eliminating the risk of coronary heart disease by mending blood lipid levels and blood pressure levels keeping away metabolic syndrome and insulin sensitivity. Dietary Fiber Fiber is nothing but the roughage that’s resistant to small intestine digestion and requires microbiota fermentation that’s available in the large intestine. Almonds top the list (9%) in highest dietary fiber levels followed by HNs, walnuts, macadamia nuts and pistachios. A normal adult is recommended to eat 25 g/day of fiber for good health and for the prevention of problems such as colon cancer, heart disease and type 2 diabetes mellitus. Minerals Minerals might be macro or micro minerals that include calcium, sodium, magnesium, potassium, chlorine, phosphorus and sulfur as macro minerals. Micro minerals include iodine, zinc, selenium, iron, manganese, copper, chromium, bromine and molybdenum. While each of the minerals are important for different functionality selenium is the most important of all as it is required for the production of a class of protein which helps with important functions such as skeletal and cardiac muscle function, T-cell immunity, thyroid hormone metabolism and antioxidant defense. Tocols Tocopherols and tocotrienols are monophenols that are present in various nuts from macadamia to black walnut. HN oil contains high quantities of Vitamin E whose content depends on the geographic location of its growth. Peeling and roasting the nut also further removes tocopherol content to a greater extent. α- and γ-tocopherol are the most prevalent forms of isomers among which α-tocopherol contains high antioxidant activity. Vitamin E is also responsible for prevention of various diseases like cardiovascular, neurodegenerative, non-alcoholic fatty liver disease and certain kinds of cancer. Phytosterols and Phytostanols Plant sterols such as phytosterols and Phytostanols are eminently present in hazelnut. Phytosterols have the ability to reduce blood cholesterol levels by reducing low-density lipoprotein cholesterol (LDL-C) levels. These plant sterols do it by disabling cholesterol absorption at the intestinal level. The presence of phytosterols in diet decreases the chances of cancers such as colon, breast and prostate cancer. Phenols We need nutrients such as minerals, vitamins and fibers for good health but the fruits and veggies that we eat contain plant secondary metabolites called as polyphenols that play a vital role in designing human health. Compared to the raw form, roasting the nut releases more phenolic content that are critical for protecting individuals against cancer. Impact of Hazelnut Consumption on Blood Lipid Levels In general, almonds, walnuts, pecans and peanuts have been shown to reduce total serum cholesterol levels (TC) and LDL levels. When researchers tried to find whether hazelnut also had such potential benefits their research was rewarded with equally beneficial effects. When all nuts could be tried and tested for their effect on heart health the reason why researchers went behind hazelnut was because of their high MUFA composition, intense presence of bioactive substances such as tocopherols and phytosterols, selenium, caffeic acid, fibers, gallic acid and p-hydroxy benzoic acid that have anti-atherogenic effect by means of biological mechanisms that act on various pathways in CVD development. The study was conducted in accordance with PRISMA statement and the search included databases such as Medline and Google Scholar. Search criteria included various associated keywords, studies were eliminated based on various criteria and two authors reviewed each report independently. Weight, height, BMI, age and gender values were noted, the number of hazelnuts consumed per day, on the number of patients, on the number of supplementation days and on the type of control diet were all noted. Though the search came up with 779 papers only 385 of them were included for full-text review. After imposing selection criteria, the researchers were finally left with only 9 clinical trials for the study. A total of 425 individuals were involved of which 195 (46%) were males and 230 (54%) were females aged between 18 and 55 years. Of the 9 studies, 5 were randomized trials and the other 4 were non-randomized trials. Six studies had only healthy participants, 2 had hypercholesterolemic subjects and one study had subjects with type 2 diabetes. Apart from systemic review a Bayesian random effect meta-analyses was performed. Results showed that of the nine studies, only 4 showed a significant decrease in mean total serum cholesterol levels (TC) and LDL cholesterol levels. Four studies saw a significant increase in HDL cholesterol levels, two studies found a significant decrease in TG and one study reported an increase in TG. Of the 8 studies with BMI data six studies showed no difference, one study showed a decrease in weight and one study showed an increase in BMI and body weight. The Bayesian meta-analysis reported that hazelnut consumption showed beneficial effects on serum cholesterol levels, including hazelnut in diet routine was definitely better at lowering serum LDL cholesterol levels and total cholesterol levels with no major difference in HDL cholesterol levels. Such distinct advantageous effect on serum cholesterol levels could be due to the lipid content of hazelnut. All these are favorable for a positive effect on cardiovascular disease (CVD) prevention. Hazelnut as a Source of Micronutrient Hazelnut, as we know from above, is a key source of micronutrient and a study now has confirmed its beneficial effects on older adults. Older adults lead a systematic lifestyle consuming certain foods that’s possible for them to chew, digest and eat in limited quantities. Nuts inclusion is not evidently present in this age group largely but this study might be an eye opener for all such adults to consume nuts- a variety of them for added health benefits. A study included 32 people aged 55 and above who ate around 57 grams of hazelnuts (1/3rd cup) daily for 16 weeks. Results showed increased levels of magnesium and vitamin E (breakdown product of alpha tocopherol). The blood samples also showed decreased glucose and LDL levels besides increase in magnesium and vitamin E levels-two of the most under-consumed micronutrients in the US where the study was conducted-and also being a healthy source of copper, healthy fats and vitamin B6. We are all very much bothered about macronutrient intake, especially fats and carbohydrates (the third one being proteins) intake but don’t give much priority to micronutrient consumption. Such decreased micronutrient intake can lead to several health problems especially in older people who are at an increased risk of age-related conditions such as Alzheimer’s disease. Many take multivitamins to compensate for lost nutrients but eating hazelnut might be a multivitamin of its own as it has a combination of many of the nutrients that humans desire for good health. It’s good to know that hazelnut comes as a complete package with aplenty benefits but many individuals suffer from nut allergies and it is essential to ensure that you are not one of them! Also, when including nuts in dishes and shakes it is possible to overconsume them ignorant of the quantity. This can be dangerous as nuts are rich sources of calories and one must always be mindful of the quantity of nuts consumed anytime. Otherwise, it can lead to unnecessary weight gain. References Effects of Hazelnut Consumption on Blood Lipids & Body Weight: https://www.ncbi.nlm.nih.gov/pmc/articles/PMC5188407/ Hazelnuts as a Source of Bioactive Compounds & Health Value Underestimated Food: https://www.foodandnutritionjournal.org/volume7number1/hazelnuts-as-source-of-bioactive-compounds-and-a-health-value-underestimated-food/ Hazelnuts Improve Older Adults’ Micronutrient Levels, Study Shows: https://www.sciencedaily.com/releases/2018/12/181206135653.htm
 Narcolepsy is Genetic, your Child is at a 40-times Higher Risk of Acquiring the Disease  Sleeping during the Day: Unusual for Others but a Daily Routine for Narcoleptics Sleeping during the Day: Unusual for Others but a Daily Routine for Narcoleptics History or Geography classes invoke sleep in most students, a post-lunch session by our professors is just like a lullaby song, office presentations sometimes transport us to a dream land and even while at work our eyes droop and we fall asleep for a minute or two in between. Such occurrences have happened in all of our lives sometime or the other and if in case you are one of those who hasn’t experienced it you must be a genius indeed. Sleep is a hobby for many, a passionate way to spend our time during weekends (getting up at 11 or 12 in the morning is not a rarity during holidays) and a relief from all the stress and anxiety we experience through the day. Sleep is an act that is dreaded by small kids, loved by teens and younger adults, wished for by middle-aged people and yearned for by older adults. The quality and duration of sleep decrease as we grow old in the case of most people.
Are you one of those who goes to sleep as soon as you instantly hit the pillow? Of course, you are blessed! In this world where peace has become a rarity, happiness a commodity and good sleep a dream-come-true, getting to sleep in a matter of few minutes is never possible for most people-blame it on smartphones, television series or unending thoughts about life’s complications we keep staring at the ceiling or rolling back and forth in our beds wide awake without sleep. Amongst all this chaos, can you imagine that some people get to sleep during morning hours, while standing in a queue, while waiting for a bus or even in the middle of talking to someone about something important! Yes, these people are not blessed nor are they normal as they are characterized by a chronic debilitating sleep disorder narcolepsy, that’s characterized by excess daytime sleepiness, sleep paralysis, hallucinations and rarely by episodes of cataplexy (partial or total loss of muscle control occurring due to emotional triggers such as laughter, joke, surprise or anger). Narcolepsy Narcolepsy is a debilitating condition that ruins the quality of life of those individuals experiencing it. Occurring equally in both men and women it affects 1 in 2000 people as early as during childhood or adolescence but rarely diagnosed immediately. There is no definite boundary between awake and asleep state in these people which causes bouts of sleep in people while they are doing daily activities. Narcolepsy cataplexy (NC) is due to the absence of chemicals called hypocretin in the brain which is duly responsible for keeping us awake and regulating sleep-wake cycles. The cells responsible for producing the chemical is destroyed in narcolepsy and without this chemical the individual experiences troubles staying awake. NC is the muscle paralysis of REM sleep occurring during waking hours. REM Sleep Sleep has four phases of which the REM phase is the last one and the other three are non-REM phases. Rapid eye movement (REM) sleep typically happens some 90 minutes after you fall asleep with the first period lasting for about 10 minutes. Other successive stages last longer and the final one might last for as long as an hour. Most of our dreams occur in this stage of sleep and the brain becomes active. REM is critical to learning and memory as this is the time during which the brain processes information from our previous day storing what’s needed and discarding the rest. While non-REM stages occur early during the night it’s the REM stage that prolongs during the latter part of your sleep. Maybe that’s why we get up in the morning right out of a dream when woken up! Creativity and dreaming have always been interrelated to each other and we do have evidences supporting it-many people have reported scientific and artistic discoveries during dreams and one classic example is that of the periodic table of Mendeleev. Creativity ratio is linked to the number of dreams experiences and the complexity of the dream too. We have also had cases of finding solutions to problems in dreams when the individuals stored these problems in their brain right before falling asleep. There are studies supporting REM sleep’s advantage on anagram solving and creative problem solving and association between distant memories but their association with creativity isn’t proven completely. Are we saying here that naps and sleeps increase a person’s creativity? This is impractical and probably the development of creativity happens over the years over many sleep periods. So, when scientists wanted to examine the role of REM sleep over such long years their first pick was patients with narcolepsy as these individuals were often transported from wakefulness to a REM sleep termed as sleep onset in REM periods (SOREMs). These individuals experience frequent naps and more importantly, repeated periods of REM in comparison to normal individuals who rarely reach REM stage during their short naps. They remember their dreams better and also experience a greater number of dreams, lucid dreams that makes them excellent candidates for displaying versatile creative skills. So, a group of researchers tested upon the creative skills of people with narcolepsy to those of controls with the help of questionnaires and tests. Creativity-linked REM Study The study was carried out in two centers in Italy and France on individuals classified as suffering from narcolepsy based on different criteria. Each of them was categorized as suffering from type 1 or type 2 narcolepsy based on whether they had frank cataplexies and hypocretin-1 deficiency or not respectively. Though these participants had a brain MRI the results were normal as expected in patients suffering from this disorder. The team also picked 30 healthy controls from both countries who experienced no sleep disorders matched the sex, age and education of the participants. All the participants completed a formal test of creativity, a questionnaire asking questions on the participants’ sleep paralysis, hallucinations and presence of cataplexy, Epworth Sleepiness Scale and the Hospital Anxiety and Depression Rating scale. The participants filled 2 creative questionnaires that include the Test of Creative Profile (TCP) and the Creative Achievement Questionnaire (CAQ). TCP contained 57 yes/no questions that covered various types of creativity including innovation, imagination and researcher profiles. Each positive answer was normalized on a 100-point scale to come to conclusions. CAQ reports achievements across 10 domains including visual arts, music, dance, architectural design, creative writing, humor, inventions, scientific discovery, theatre/film and culinary arts whose scores were from 0 to 7 with 0 representing no expertise in the domain and 7 indicating tremendous expertise. The Evaluation of Potential Creativity (EPoC) is an objective test evaluating creative abilities containing 8 subsets assessing two models of creative thinking which includes divergent-exploratory thinking and convergent-integrative thinking. While participants were asked to generate multiple ideas based on a single stimulus in the former, they were asked to incorporate multiple elements to form a unique production (such as different characters to form a story) in the latter case. 10-15 minutes of time was given based on the task at hand and the total duration of the EPoC test was for 2.30 hours which included a 30-minute break which was used to sleep by 6 of the 30 subjects. Totally, 185 volunteers (71% had type 1 narcolepsy and 29% had narcolepsy type 2) participated in the study which included 118 from Paris and 67 from Bologna. 126 healthy controls were matched for age, sex and gender. Education levels were lower in the narcolepsy group compared to the control group. 30 subjects each from the narcolepsy and the control group who performed the EPoC test did not differ in age, gender and education while participants with narcolepsy experienced more frequent sleeps, higher levels of daytime sleepiness and depressive symptoms. Results showed that:
References Increased Creative Thinking in Narcolepsy: https://academic.oup.com/brain/article/142/7/1988/5506053 Narcolepsy: https://www.sleepfoundation.org/articles/narcolepsy George Church Ascribes his Visionary Ideas to Narcolepsy: https://www.statnews.com/2017/06/08/george-church-narcolepsy/  Aerobic Exercises Such as Walking Work Wonders on Heart Health Extra leg space, extra-large dresses, extra cheese pizzas and extra seating space in aircrafts have become a normalcy these days. We can see a greater number of obese/overweight individuals compared to those with a normal weight. Eateries and restaurants selling buttery chicken wings and juicy cheeseburgers have only been rising in proportion. Humans today live in a world where leading life has become easier due to technological advancements and scientific discoveries, all of which have led to a greater increase in global inactivity. Such inactivity has paved way for more and more people to engage in a sedentary lifestyle that prevails as one of the biggest health problems in today’s world. That’s because, the body becomes weak due to continuous inactivity and this reduces the resistance to various diseases such as type 2 diabetes, obesity, hypertension and coronary heart disease. Time and again health experts have been insisting on the importance of physical activity to ensure leading a healthy and nutritious life but we don’t bother to pursue such advices to ensure well-being of our body until some disease or infection strikes us.
Cardiovascular disease is widespread worldwide and sadly, its not only the older generation but younger adults too who are becoming victims of this grave disease. Research shows that inactivity, rising obesity rates and lifestyle behaviors are serious threats to heart health and we do have positive research studies showing that cardiovascular risk factors greatly improve with heart-related changes that occur as a result of regular exercise sessions. Exercise is treated to be the nonpharmacological way of treating cardiovascular patients undergoing cardiac rehabilitation (CR) programs to improve their heart health and overall body fitness. Generally, all CR programs recommended heart patients to take up continuous moderate intensity aerobic training (CAT) such as walking and cycling as it is believed to reduce mortality rates, both cardia and other cause-mortalities. Generally, heart patients were always advised against performing strenuous exercise programs as it might be risky for the heart but of late, there have been more intense aerobic programs tested on cardiac patients that are proven to be safe and more effective than CAT in improving the patient’s overall cardiac outcomes. While aerobic training has been around for years, resistance training was not something that was a part of the exercise schedule of patients with heart conditions until the last two decades or so during which numerous advantages such as metabolic risk factors, functional capacity and psychological well-being were unraveled. Left Ventricle’s Prominent Place in Determining Heart Health Exercise training helps improving exercise capacity and cardiac output by increasing left ventricular functioning. There are studies that show that structural and functional changes in the left ventricle during exercise are prominently witnessed than changes in the other parts of the heart. Performing exercise elevates left ventricular stroke volume by increasing intrinsic cardiac contractility and improving left ventricular filling. The type of sport/exercise performed determines the framework adaptations in the left ventricle. Endurance training is one of the four types of exercises alongside strength, balance and flexibility that includes activities such as jogging, swimming, walking and cycling. Also known as aerobic training, practicing it regularly helps causing different changes in the structure and function of the heart and skeletal muscles. Resistance training helps in developing both left ventricular (LV) diastolic and systolic functions. Its been established that left ventricular training helps promote heart function but it would help further if we determine whether step-aerobic or core exercises help in improving left ventricular cardiac function development and also to minimize heart-related risk factors during middle age and beyond and the study below discusses this possibility. The study involved 45 healthy, sedentary women who were not involved in regular physical activity (more than 60 minutes a week), did not take any anti-pregnancy drugs, cigarettes or medications and were also devoid of diseases such as heart disease, respiratory, metabolic and inflammation disorders. Each of the participants were put into one of the two groups: step-up aerobic group (SAG) consisting of 25 participants and core exercise group (CEG) consisting of 20 participants. The study happened for four months and the exercise programs allocated for the two groups happened 4 days a week on all 16 weeks consecutively. Target heart rate (THR) was controlled using a heartbeat monitor and exercise intensity was also progressively increased every week from HR 60% to up to 70% (such as between 1st and 4th week it was HR 60%, between 5th and 8th week it was HR 65% and between 9th and 16th week it was HR 70%). Every exercise session happened for a full 60 minutes consisting of warm-up exercises (10 min), primary exercises (30-40 min, basic movements step-aerobic) and cool down exercises (10 min) in the case of SAG and for CEG warm up and cool down remained the same while primary exercises practiced for 40 minutes composed of core exercises that help in building more strength for lower and upper extremities that includes 3 sets/day, 10 repetitions/set with 1-2 minutes resting interval. Height and weight measurements were taken, BMI readings were calculated, waist circumference, hip circumference and waist-to-hip ratio were also measured. BP measurements were taken and blood samples were taken in the morning after an overnight fast before and after the study. Two-dimensional echocardiography was performed before and after the 16-week study period, and variables such as LV end-diastolic dimension (LVDD), end-systolic dimension (LVSD), interventricular septum thickness (IVS), left ventricular posterior wall (LVPW) MDT-mitral deceleration time, left ventricular ejection fraction (LVEF) and left ventricular fractional shortening (LVFS) were measured. Results showed that:
Improving Left Ventricular Systolic & Diastolic Function in Adolescents with Type 1 Diabetes Diabetes is one of the biggest public health problems that’s been attacking humanity inconsolably and the best means to curb this epidemic is to eat nutritious diets and exercise regularly. But what we lack is enough knowledge on whether exercise improves cardiac hemodynamics in adolescents with type 1 diabetes. Researchers have tried to analyze left ventricular volume at rest and also during exercise in individuals with type 1 diabetes compared to those without diabetes before and after a 20-week exercise training program. Adolescents aged between 14 and 18 years who were free of problems such as hypertension, neuropathy, retinopathy or microalbuminuria and suffered only from diabetes were involved in the study. 38 (20 males) participants with diabetes and 22 control participants were involved in the study. BMI, body composition, height, weight and abdominal obesity were measured. Exercise sessions lasted for 60 minutes each four times a week over a 20-week period. Exercises were modified to achieve 85% of the participant’s heart rate. During the 1st-12th week participants performed three days of aerobic exercises and one day of resistance training whereas from weeks 12-20 all of them were involved in 4 sessions of combined aerobic and resistance training. During the study period three participants dropped due to time commitments and finally only 72 participants remained: 37 of them with type 1 diabetes in exercise training group, 13 of them with type 1 diabetes in the control group and 22 adolescents without diabetes in the exercise training group. Though both groups with diabetes increased total body weight it was more of fat-free mass compared to the control group with type 1 diabetes that gained weight due to fat deposition. The exercise sessions had a positive impact on body composition and helped in reducing percentage body fat and increasing fat free mass and bone mineral density. Exercise training had no impact on the resting and maximal exercise systolic, diastolic and mean arterial pressure but there was an increase in arterial pressure in the control group with type 1 diabetes after 20 weeks. The study showed that exercise improved the left ventricular function of both training groups at rest and also the submaximal exercise cardiac output, stroke volume, end-diastolic volume and ejection fraction. While improvements were witnessed in both training groups maximal effects were seen in the group with diabetes. Also, left ventricular filling and contractility improved after exercise training in adolescents with diabetes proving that exercise helps in preventing/postponing left ventricular function impairment in those patients with diabetes. Hence, this study clearly shows that regular practice of exercise over a period of 20 weeks was associated with improvements in left ventricular function. In trained teens with diabetes the results were similar to that achieved in untrained controls without diabetes. References The Effect of Exercises on Left Ventricular Systolic & Diastolic Heart Function in Sedentary Women: https://www.sciencedirect.com/science/article/pii/S1728869X17300953 Exercise Training Improves but does not Normalize Left Ventricular Systolic & Diastolic Function in Adolescents with Type 1 Diabetes: https://care.diabetesjournals.org/content/40/9/1264  Later the Diagnosis for Ovarian Cancer, Lesser the Chances of Survival  A Diet Rich in Fiber is Good for Health Irrespective of Whether or Not it Has Impact on Cancer Risk A Diet Rich in Fiber is Good for Health Irrespective of Whether or Not it Has Impact on Cancer Risk Ovarian cancer prevails as the leading cause of death (1,50,000 deaths annually) in gynecological cancers worldwide and is the second most common female reproductive malignant tumor (240,000 cases erupt every year). Awareness about ovarian cancer has increased tremendously during recent times but still we lack the knowledge to get it diagnosed at an early stage. This disease often remains undiagnosed until later stages by which time it has 100% chances of spreading to the abdominal cavity. We boast of scientific advancements and research in the field of ovarian cancer in the past few decades but still lack a definite prognosis that could help treat patients in their early stages of ovarian cancer despite advances in treatment options. Though the cancer generally affects women who have been through menopause (mostly above the age of 50) there are chances of it affecting younger women too. While the exact causes of ovarian cancer remain unknown, we do know that age (above 50 years), family history of breast or ovarian cancer, endometriosis and being overweight are serious risk factors. We do have data supportive of the fact that dietary factors such as glycemic load, dietary phytoestrogen, fat, fruits and vegetables do play a role in impacting ovarian cancer risk. Fruits, vegetables and whole grains are excellent sources of fiber, a nutrient that has been inversely linked to the risk of several types of cancers such as colorectal, endometrial, gastric and ovarian cancer. But the role of diet, especially fiber has been greatly conflicting providing us with inconsistent results that prevent us from either supporting or denying the role played by fiber in affecting the risk of ovarian cancer. Some studies supported the fact that intake of dietary fiber was inversely proportional to ovarian cancer risk but some others failed to prove the connection and moreover, the effects varied depending on the type and source of fiber consumed.
Systematic Review of Ovarian Cancer Risk The Women’s Health Initiative (WHI), a trial consisting of 48,835 postmenopausal women was the only primary prevention intervention trial that proved that eating a low-fat diet reduced the risk of ovarian cancer risk by 40%. But we do have descriptive data going as early as 1975 showing that there could be an association between dietary fat and ovarian cancer risk. There were also several results supporting that while veggies, whole grains and low-fat milk reduced ovarian cancer risk, meat intake increased the risk but still we did not get any conclusive results. To compare all the different study results and come to certain conclusions a systematic review following the recommendations of Preferred Reporting Items for Systematic Reviews & Meta-analysis Approach (PRISMA) with the help of search engines such as PubMed, MEDLINE, etc. were conducted and finally, 24 publications that met the inclusion criteria were included in the review. Many reviews supported that increased fat intake increased ovarian cancer risk while vegetables consumption decreased the risk significantly. A Canadian study tried looking into the perspective that fiber intake reduced the risk of ovarian cancer significantly but neither total fiber nor specific fiber types showed a significantly lower risk for ovarian cancer. The review clearly concluded that fiber did not have any impact on ovarian cancer risk in any way. Meta-analysis of Observational Studies Owing to inconclusive evidences in relation to the risk of ovarian cancer risk and fiber intake, two investigators searched databases such as PubMed and Web of Science using several word search criteria and inclusion criteria. They were left with 2784 publications that had a link between fiber intake and ovarian cancer risk. But it was only 17 studies that met the inclusion criteria of which four of them were cohort studies and the remaining 13 were case-controlled studies-10 of them were from United States, four from Europe and three from Asia. Results showed that:
Another meta-analysis followed the standard MOOSE and PRISMA to report the analysis and used databases such as PubMed and EMBASE to sort through the studies. Two investigators were involved here too who used specific search terms to narrow down study inclusions and finally were rewarded with 4665 articles of which 4641 were excluded as they did not meet the study criteria. Again 11 of them were excluded due to several criteria leaving the researchers with only 13 of them that contained 5,777 ovarian cancer cases and 1,42,189 participants. Of the 13 studies, 10 of them were case-controlled and 3 were cohort studies all of which measured dietary intake with the help of a food-frequency questionnaire. Results showed that:
Earlier identification of ovarian cancer paves way for better treatment and curing chances. But often we don’t recognize ovarian cancer until it has already spread. Even if treatment is successful there are greater chances that the cancer might recur in a few years’ time and in this case, there is no cure. It can only be controlled with the help of chemotherapy which can help in extending the patient’s life by several months or years. Hence, prevention is better than cure. While family history or age factor is not in our hands, we can do as much as we can to reduce the risk when it comes to dietary modifications and lifestyle factors. Results of fiber, vegetable and fruit intake and their association in reducing the risk of ovarian cancer might be inconclusive but we are sure that these foods are indeed good for our health and there is no harm in eating them. Consuming the right kind of foods, staying on a normal body weight and exercising regularly helps reduce the risk of ovarian cancer greatly. References Dietary Intake & Ovarian Cancer Risk: A Systematic Review: https://cebp.aacrjournals.org/content/23/2/255# Association between Dietary Fiber Intake & Risk of Ovarian Cancer: A Meta-analysis of Observational Studies: https://www.researchgate.net/publication/327215865_Association_between_dietary_fiber_intake_and_risk_of_ovarian_cancer_a_meta-analysis_of_observational_studies Dietary Fiber Intake & Reduced Risk of Ovarian Cancer: https://nutritionj.biomedcentral.com/articles/10.1186/s12937-018-0407-1 Heart, kidneys and liver are the ones that come to our mind at the mention of the word ’organ’. While the skin is present all over our body how many of you are aware that the skin is an organ let alone the fact that it is the largest organ in the human body. Each of us are blessed with a different skin type which doesn’t only include skin color but also its texture and a vast array of microorganisms that reside on it. These microbes don’t stay on the skin forever as the skin renews itself occasionally thereby shedding away these organisms. While most of them are not harmful, some of them are even beneficial helping in secreting antibacterial substances or preventing pathogen colonization and some others harmful causing diseases and infections. We do know that a newborn’s gastrointestinal tract contains millions of microbes that are initially acquired from the mother through breastfeeding and also environmental exposure and the same is true in the case of skin’s microbiome too. Once the initial colonization is complete, the microbiome composition keeps varying in response to factors intrinsic and extrinsic to the host. The host of microbiomes present varies from individual to individual and also from location to location on the individual.
Probiotics and prebiotics are dominating the nutrition world right now for their good health. Probiotics are good microorganisms that are ingested by an individual to enable a healthy GI tract while prebiotics are ingredients that support the growth of these good microorganisms. Dietary requirements of microorganisms vary between species and an agent that exhibits prebiotic activity on a particular microorganism might not exhibit the same prebiotic effect on another one. We are in an advanced world where lifespan is rapidly growing and people are living well beyond 65 years. More than 566 million people are above the age of 65 presently and the population is estimated to be 1.5 billion by 2050. But within these individuals’ life duration they are expected to witness increased hospital times and repeated exposure to antibiotics. Infections are responsible for a third of the mortality rates in elderly population and this can be attributed to changes in immune system that become less effective in handling microbial infections. The microbiome of a person’s skin comes of use here as altering it and enhancing the good bacteria content has the potential to avoid infection, reduce their presence and effect. So, enhancing the health of an individual’s skin becomes a priority now and the invention in this patent provides a method for doing exactly the same. The invention here aims at using bacteria that are modified to enhance characteristics that we believe are advantageous for the skin microbiome and health of the individual which includes bacteria that have been modified using a CRISPR-Cas9 and/or Cpf1 system. Rather than altering the human genome the invention here tries to modify the skin microbiome to enhance health. The invention might include a method for altering the skin’s microbiome by administering an effective amount of bacterial formulation on the skin of the individual. For instance, if the subject is a newform the formulation which might be an ointment, lotion or gel is rubbed onto the newborn’s skin within 6 hours of birth to address certain concerns in the newborn. The bacteria added in the formulation depend on the diseases or concerns that are addressed. The formulation might be applied within 24 hours of birth, within 6 hours of birth, within 3 hours of birth or within even an hour of birth even in the form of a spray or mist. It depends on the mother to choose for her baby-either rely on chances to the presence of critical microbes that form the immune system or use a predetermined formulation that contains a specific combination of microbes which help the newborn’s immune system to react to the microbes in the predetermined formulation helping the baby get equipped with a more variant immune tolerance profile. A specific aspect of this invention relates to the treatment of acne-a common skin problem that accounts for a quarter of dermatologists’ patient volume. Acne has a tremendous impact on the person’s quality of life upsetting his/her emotional as well as social well-being. Bacteria selected in the formulation help relieve acne problem when applied onto the individual’s skin and these are generally ammonia oxidizing bacteria. The invention is also directed at incorporating bacteria into various skin-care products, deodorants, sunscreens, fragrances and those for oral or dental hygiene and hair care products. Generally, we use anti-bacterial agents to kill bacteria which also kills useful bacteria on the person’s skin in this process. But the present invention aims at intentionally exposing the skin to microbes (good bacteria) to treat skin infections, diaper rash and urinary/vaginal infections. All gram-negative bacteria are disease producing and one aspect of this invention is aimed at reducing the number of gram-negative bacteria on a person’s skin by adjusting the overall pH of the skin tissue region. We do joke that mosquitoes love certain people’s skins and this invention has proved it. In one embodiment the bacteria are modified to express certain compounds that deter mosquitoes from contacting human skin. The present invention plays a key role in our daily lives helping us enhance our quality of life by enhancing skin health. The patent was published on May 4th, 2017 and for more details on this invention please visit the following sites: Unites States Patent & Trademark Office: http://patft.uspto.gov/netacgi/nph-Parser?Sect1=PTO2&Sect2=HITOFF&u=%2Fnetahtml%2FPTO%2Fsearch-adv.htm&r=114&f=G&l=50&d=PTXT&p=3&S1=((health+AND+exercise)+AND+fitness)&OS=health+AND+exercise+AND+fitness&RS=((health+AND+exercise)+AND+fitness) World Intellectual Property Organization: https://patentscope.wipo.int/search/en/detail.jsf?docId=US195462458&_cid=P10-JYH7PR-65448-1  Foot Amputation is Common in Patients with Diabetes Neuropathy  Neuropathy Signs are Verified Using Pinprick or Even Temperature Control Neuropathy Signs are Verified Using Pinprick or Even Temperature Control There are millions of people affected by diabetes, millions affected by hypertension and also million others who have a combination of diabetes and hypertension leading their lives. Hypertension is a comorbid condition very commonly seen in up to 75% diabetic patients depending on their obesity, age and lifestyle. It usually presents as a metabolic syndrome of insulin resistance that includes central obesity and dyslipidemia as well. Such comorbid presence of hypertension increases the risk of microvascular and macrovascular complications. Macrovascular complications include coronary artery disease, myocardial infarction, stroke, congestive heart failure and peripheral vascular disease and microvascular complications generally include retinopathy, nephropathy and neuropathy. Microvascular conditions are generally linked to hyperglycemia but hypertension too is a valuable risk factor for these conditions.
Diabetic Peripheral Neuropathy (DPN) Diabetic Peripheral Neuropathy (DPN) is damage to nerves that sit near the skin and is a very common effect of diabetes that almost 50% people with type 2 diabetes and 20% people with type 1 diabetes suffer from it! It is most commonly nerve damage (to two types of nerves) caused to the hands and feet. While researchers still question how diabetes kills nerve cells, they have come up with other important causes such as high cholesterol, obesity and high blood pressure as major contributing factors. A British report in a study conducted more than a decade back on 37,000 people with type 2 diabetes for almost 9 years showed that high blood pressure increased risk of neuropathy by 11-65% in these participants. The explanation given here is that metabolic changes due to diabetes increases number of free radicals that attack cell DNA thereby killing antioxidant compounds that help in protecting the cell from free radicals and inflammation. Also, the nerve fibers rely on blood vessels for nutrients and oxygen supply and high blood sugar/blood pressure levels damage these blood vessels preventing any supply to the nerve fibers. DPN affects almost 70% people with diabetes and exists as the leading cause of foot amputation. It usually is the result of prolonged diabetes in individuals and is associated with metabolic derangements such as increased polyol flux, accumulation of advanced glycosylation end products, lipid derangements and oxidative stress. Extremely stringent measures to control blood sugar levels is recommended for controlling DPN but this also only helps in preventing progress of the disease in type 1 diabetes mellitus (T1DM) patients but shows no benefits in individuals with type 2 diabetes mellitus (T2DM). There are numerous clinical and experimental studies showing that hypertension exists as an independent risk factor for DPN in patients with T1DM or T2DM. Hypertension mostly affects the myelinated fibers and studies in hypertensive rats with diabetes show a reduction in sciatic nerve blood flow along with a reduction in motor and sensory nerve conduction velocity and myelinated fiber density but no loss of intraepidermal nerve fibers. In a hypertensive T2DM model a reduction in sensory nerve conduction velocity and increased matrix metalloproteinase was witnessed at sites of myelin thinning. In nondiabetic rats affected by hypertension impaired epineural arteriolar function led to reduced endoneurial perfusion and neuropathy. But a combination drug helped in preventing and reversing nerve conduction and nerve abnormalities in type 2 diabetes rats. Elaborated below is a detailed study helpful in exactly identifying the impact of hypertension on both large and small fiber measures of DPN in patients with T1DM. Effect of Blood Pressure on Type 1 Diabetes Patients with Neuropathy Participants with T1DM and controls without diabetes were chosen based on multiple exclusion criteria which included hypothyroidism, corneal surgery in the last 6 months or so, vitamin B12 deficiency, neuropathy from nondiabetic causes, corneal trauma and diabetes or impaired glucose tolerance in the control group. BP measurements were taken in sitting position after a rest period of 5 minutes on 2 occasions. Systolic blood pressure readings ≥140 mm Hg or subjects on antihypertensive treatment were defined as suffering from Hypertension. Each of the participants were measured for their body mass index (BMI), glycated hemoglobin (HbA1c), cholesterol and triglycerides. Each of the participants were declared to be suffering from DPN or not based on certain criteria such as neuropathy symptoms or neuropathy signs and an abnormality of NCS or some known measure of small fiber neuropathy. Neuropathy symptoms included unsteadiness in walking, neuropathic pain, paresthesia and numbness each of which was given scores up to 4. A score ≥1 indicated the presence of a neuropathic symptom. The signs of neuropathy were verified using a pinprick on the tip of the large toe, temperature perceptions in the dorsum of the feet and the presence or absence of ankle reflexes. Any score >2 of 10 was confirmed to be a sign of neuropathy. Corneal confocal microscopic images from the subbasal nerve plexus in the central cornea was noted for each eye. Corneal nerve fiber density (CNFD) and length of nerve fibers (CNFL) were measured. Skin biopsy was taken and cardiac autonomic neuropathy was evaluated. Assessment of Sural sensory nerve action potential (SNAP), sural nerve conduction velocity (SNCV), tibial compound motor action potential (TCMAP), tibial motor nerve conduction velocity (TMNCV), peroneal compound motor action potential (PCMAP) and peroneal motor nerve conduction velocity (PMNCV) was done in the right lower limb by a consultant neurophysiologist. On the whole, 58 normotensive controls, 20 hypertensive controls, 30 normotensive and 40 hypertensive T1DM participants were involved. Systolic and diastolic blood pressure were comparably higher in the hypertensive compared to the normotensive groups. While hypertensive controls exhibited higher blood cholesterol levels compared to normotension controls values of HbA1c, triglycerides and BMI were comparable. Hypertensive T1DM participants expressed higher triglycerides and BMI compared to normotensive T1DM participants but HbA1c and cholesterol were comparable. Results showed that:
In another study on 467 participants aged between 45 and 64 done by the University of Toronto in 2015 almost half of those with prediabetes or newly diagnosed type 2 diabetes showed early signs of peripheral neuropathy. Higher the blood sugar levels likelier are the chances of nerve damage. Diagnosis of patients with type 1 diabetes usually happens at an early stage and about 20% of them have peripheral neuropathy after 20 years. While age does seem to be a contributing factor for people with DPN there are cases of even small kids and young adults with type 1 and type 2 diabetes who show signs of peripheral neuropathy. Also, nerve damage is irreparable causing great loss in the ability to feel and move irrespective of however the nerves could get damaged. Damage Control You might suffer from any form of diabetes but if you don’t have nerve damage it is highly possible to avoid suffering from neuropathy if you control blood sugar levels and pursue other healthy steps. If you suffer from T1DM tight glucose control can eliminate DPN risk by 78% while for those with T2DM it reduces the risk by 5-9%. This vast variation in risk control might be due to the diagnosis stage. T1DM is usually diagnosed earlier preventing most nerve damages while T2DM patients might lead a life with the disease for years together before diagnosis. Such prolonged existence of T2DM without medications and sugar level control leads to nerve damage even from the prediabetes stage and this indicates ample irreparable nerve damage that is caused before a diagnosis is made. There is nothing that can be done about nerve damage that has already happened but we can prevent further damage by taking good care of our health. References Hypertension Contributes to Neuropathy in Patients with Type 1 Diabetes: https://academic.oup.com/ajh/article/32/8/796/5477297 The Comorbidities of Diabetes and Hypertension: Mechanisms and Approach to Target Organ Protection: https://www.ncbi.nlm.nih.gov/pmc/articles/PMC3746062/ Diabetic Neuropathy: Causes and Symptoms: https://www.endocrineweb.com/guides/diabetic-neuropathy/diabetic-neuropathy-causes Treatment of Hypertension in Adults with Diabetes: https://care.diabetesjournals.org/content/26/suppl_1/s80  Practice Healthy Eating & it Surely Does Become a Habit  It's Ok to Occasionally Indulge in a Cheat Meal which Keeps You Bonded & High Spirited It's Ok to Occasionally Indulge in a Cheat Meal which Keeps You Bonded & High Spirited Human mind is like a monkey that cannot help but keep jumping from one thing to another. Many times, our hearts rule our brains and we take decisions based on our interests and pleasures rather than focusing on goals and needs. Food occupies a major role in our lives and we face debilitating health consequences owing to the wrong types of foods that we choose to eat. Given a choice between French fries and salads most would pick French fries. Choices spoil us unless they are all good ones that promote health! Obesity in adults and kids is a worldwide epidemic and exists as one of the most important problems worldwide. Obesity in childhood heightens the risk of health problems in adulthood, even more in kids who have obese parents. We have more than 45 million children who are obese worldwide and there is a dire need to stop this obesity epidemic immediately. There have been multiple steps taken and strategies implemented to reduce weight gain but all of them have been from an individual perspective. Children are children and such approaches might result in weight loss but this is only temporary and for a short-term as they once again go back to their earlier eating routines and practices after some time. This is mainly due to the fact that our environment has now become one that promotes consumption of high-energy foods and sedentary behavior. We would define such an environment as an ‘obesogenic’ environment-in simple terms, its an environment that encourages people to eat unhealthy food and not do enough exercise, promotes sedentary behavior and contributes to everything that increases obesity risk.
Individuals interact with the environment in different levels-homes, schools, neighborhoods and friends-and the fact is that, we don’t have much control over things that happen in the environment. Childhood obesity is the sum total of genetics, environment and behavioral response. Genetics is not in our hands and certain environmental factors too cannot be controlled but we can focus on changing the ones that can be influenced and also finetune behavioral response-for instance, the child’s eating behavior and family environment does affect obesity and this can be handled internally. Recently, there have been serious steps taken to alter ‘obesogenic’ behaviors and obesity development such as by modifying environmental factors. Environmental factors operate at micro (home, school, neighborhood) and macro (government, health system, food industry) levels. While macro environmental factors are not flexible to change, we can do bring about changes to the family food environment (FFE) that also seems to be the greatest contributor of obesity when compared to school and neighborhood. FFE also affect the eating behaviors of the kid greatly. When parents control eating habits of children it has been associated with increased body weight in kids and has also increased their inclination towards obesogenic eating behaviors. Even watching television and availability of fruits/veggies at home increase obesogenic eating behaviors in kids leading to overweight issues. Family Food Environment FFE is not something new and there are numerous FFE variables such as frequency of family meals, parental feeding strategies, viewing TV/electronic gadgets while having meals, parent’s food and nutrient beliefs, parent’s cooking and shopping skills and parent’s nutrition knowledge that have been analyzed individually for their impact on obesogenic eating behavior but we don’t have results on the collective impact of these variables. We also don’t have data on the impact caused by psycho-social factors such as income, parent’s marital status, depression status or parent’s BMI on FFE variables. An Australian study aimed at using factor analysis to derive composition of FFE variables and their effect in obesity and obesogenic eating behaviors. Also, the impact of psycho-social factors on FFE variables is dealt with. Australian parents of children aged 2-5 years were included in the study based on an advertisement posted on the social media platform Facebook. All the participants were recommended to calculate height and weight measures of themselves and their kids using household measures such as bathroom scales or tapes. Children’s eating behavior was measured using sub-scales of the Children’s Eating Behavior Questionnaire (CEBQ that focused on enjoyment of food, food responsiveness, satiety responsiveness, food fussiness and slowness in eating). The 8 Feeding Practice and Structure Questionnaire (FPSQ-28) included Reward for Behavior (4 items), Reward for Eating (4 items), Persuasive feeding (6 items), Covert Restriction (4 items), Overt Restriction (4 items), Structured Meal Setting (3 items), Structured Meal Timing (3 items) and Family Meal (single item). Family meal frequency was measured based on three items including breakfast, lunch and dinner, general nutrition knowledge score was created based on a general knowledge questionnaire and four nutrition belief items (Eating healthy is expensive, It takes too long to prepare a healthy meal, Healthy food doesn’t taste good and Nutrition is important to your family’) were also measured apart from measurements on parental stress, anxiety, cooking and shopping skills. A total of 977 participants were fetched of which 7.6% of them were underweight. The aim of the study was to reflect upon the impact of FFE variables on obesity and hence underweight children were excluded from the study leaving just 757 participants who were parents of children aged between 2 and 5 years. Results showed that:
Imposing SEM Concept on Obesogenic Behavior Another study aimed at introducing an integrated model based on three basic concepts (parental socioeconomic status, parental feeding behavior and child’s food intake) within the Structured Equation Modeling (SEM) framework. In order to figure out the major factors involved in determining childhood obesity relationship among child technology use, child’s average amount of sleep, child’s school grade, child’s physical activity, parent’s physical activity and the child’s weight was noted. Parental socioeconomic status was measured based on six indicators that included the mom’s education, dad’s education, mother’s income, father’s income, mother’s work experience and father’s work experience. The last was ‘How long have the parents been married?’ Parental feeding behavior that included restricting, monitoring, rewarding, pressurizing, controlling and modeling was measured on a 5-point scale with higher scores indicating a more frequent use of a specific feeding behavior. Child’s food intake was measured based on seven indicators including consumption of fruits, vegetables, whole grain products, sweets, chips, soft drinks and fast food where parents indicated on a six-point scale (never, seldom, sometimes, most of the time, always and several times a day) how often their kids ate certain foods. Control variables were measured: Parental physical activity was measured by categorizing parents into four categories based on their answers: none, 1 or 2 times a week, 3 or 4 times a week and more than 4 times a week. The kid’s average number of sleeping hours was categorized into ‘less than 7 h per day’, ‘7 to 8 h per day’, ‘8 to 9 h per day’ and ‘more than 9 h per day’. The child’s screen time was categorized into ‘less than an hour every day’, ‘1 to 2 h per day’, ‘3 to 4 h per day’ and ‘more than 4 h per day’. Child’s physical activity was sorted into ‘1 to 2 times per week’, ‘3 or 4 times per week’ and ‘more than 4 times per week’. BMI of 402 observers was in the normal range and 147 observers was overweight or obese. The study presents two structured models: one based on the normal BMI range (normal model) and one based on obesity BMI range (obesity model). Results showed that:
References Family food environment factors associated with obesity outcomes in early childhood: https://bmcobes.biomedcentral.com/articles/10.1186/s40608-019-0241-9 Family environment & childhood obesity: https://www.ncbi.nlm.nih.gov/pmc/articles/PMC5334735/  Its Time to Cherish Garlic’s Therapeutic Side of Story Diabetes is one of the leading causes of death and there are more than 400 million people suffering from diabetes worldwide most of them belonging to developing countries. The global diabetes rates have risen from 4.7% in 1980 to 8.5% in 2014 and according to WHO estimates, diabetes was the seventh leading cause of death in 2016. Diabetes is hereditary and those with family members suffering from diabetes are at an increased risk of the illness but there is no hard and fast rule that says that people with a family history of diabetes are sure victims to the disease. Its only that their risk is one step higher than the rest of the population. But with regular physical activity, normal body weight and diet schedules it is always possible to prevent or delay the onset of type 2 diabetes mellitus (T2DM) which is more frequent in overweight young adults and aged populations. T2DM has the ability to leave the patient with increased risk of heart attacks, strokes, kidney failure, foot ulcers and diabetic retinopathy. There have also been statistical data showing that one of every four diabetes patients suffer from depression which in turn could increase the risk of T2DM-related complications. Once a patient’s blood sugar levels are higher than normal levels the patients are started on diabetes medications. Medicines are dispensed to reduce the risk of even those individuals who are in a pre-diabetes stage where regular physical activity, exercise and an active lifestyle would definitely help in controlling sugar levels greatly and this is due to the flexibility and low-cost nature of drugs. Once you start your body on anti-diabetes meds it’s going to remain likewise for a lifetime.
Metformin is presently the first choice of medication along with diet and lifestyle changes for treating type 2 diabetes as it helps in lowering fasting plasma insulin concentrations, total and LDL cholesterol and free fatty acids. Metformin is used as a preventive medicine for middle-aged obese individuals. Still, we are unable to do anything about the long-term complications of the drug. With the ever-increasing diabetes rates, it is necessary to come with solutions that are safe, cost effective and above all, provide excellent glycemic control. When we talk about all these qualities in a solution what’s better than alternate medicines and natural therapy? Even the World Health Organization Expert Committee on diabetes has recommended the research of traditional herbs for coming up with solutions for treating diabetes mellitus, the most common of them include Allium sativum (garlic), Ginseng species, Momordica charantia (bitter melon), Trigonella foenum-graecum (fenugreek) and A. cepa (onion). Garlic is an ingredient that has ruled our kitchens for thousands of years being one of the oldest plants cultivated. It also finds itself useful as a therapeutic agent thus occupying a permanent spot in our lives-it contains compounds such as allicin (exhibits hypocholesterolemia), is an antioxidant, hypotensive, anticoagulant and also has antithrombotic effects. It’s been seen that consuming 10 g of raw garlic per day along two meals for six weeks helps in reducing blood glucose and HbA1c levels in patients with diabetes mellitus and we have research also showing that consuming garlic helps in improving blood HDL-cholesterol levels. There are also studies showing the beneficial effects of garlic in reducing blood pressure levels, risk of cardiovascular disease and colorectal cancer. Garlic is surely a hot-selling cake in the research world as its being studied more and more with respect to blood sugar management. A bunch of randomized control trial (RCT) were conducted in the last decades to see its effect on blood sugar management. While we don’t have a thorough analysis the study here is a meta-analysis of all the available RCTs to understand the functioning and efficiency of garlic supplements/extracts in controlling T2DM and its impact on total cholesterol, triglyceride, high density lipoprotein (HDL) and low-density lipoprotein (LDL). A Meta-analysis on the Effect of Garlic Extracts The meta-analysis was reported using PRISMA guidelines and online searches were conducted in PubMed, EMBASE, Cochrane Library and China National Knowledge Internet (CNKI). Search terms were included after careful research and finally, eligible studies were included based on different criteria and duration of garlic administration. The search yielded 226 abstracts of which 216 of them were rejected as they did not meet study criteria. Finally, only 10 articles were involved in the study and this included 430 patients in the garlic group and 338 T2DM patients in the control group. Fasting blood glucose (FBG) levels were between 6.2 mmol/L to 12.2 mmol/L. Five therapies included monotherapy of garlic for T2DM that was diagnosed newly and four trials included therapy that was a combination of garlic and an oral hypoglycemic drug for T2DM that was already diagnosed. Garlic doses were between 0.5g to 1.5 g daily administered for anywhere between 2 and 24 weeks. Outcomes were measured from 1 to 24 weeks for FBG, 1-4 weeks for plasma fructosamine and 12-24 weeks for HbA1c. Effect on FBG: FBG reports were mentioned in 7 trials. Depending on the duration of garlic administration patients were put into any one of the five subgroups: short-term (≤8 weeks) and medium-term (>8 weeks) periods. In short-term subgroup, meta-analysis results in 1-2 weeks, 3-4 weeks and 6-8 weeks showed that garlic consumption showed evident reduction in FBG levels compared to controls. In the medium-term subgroup too, garlic helped in reducing FBG levels at 12 and 24 weeks compared to control group. Effect on plasma fructosamine: This was reported in two trials. Meta-analysis results in 1-2 weeks and 3-4 weeks showed significant reduction in plasma fructosamine levels in the garlic group compared to the control group. Effect on HbA1c: 2 trials reported on HbA1c. Meta-analysis in 12 and 24 weeks showed that garlic reduced HbA1c levels in garlic group compared to control group. Effect on Other Indexes: Postprandial blood glucose levels also reduced significantly after garlic consumption compared from 2 weeks to 12 weeks. C-peptide was higher in garlic group. Effect on blood liquids: Cholesterol, triglyceride, HDL and LDL were compared in 1-2 weeks, 3-4 weeks and 12 weeks. Triglyceride levels reduced in 3-4 weeks of garlic consumption and in 12 weeks for total cholesterol and LDL levels. There was an increase in HDL levels in 12 weeks too after garlic consumption. Side effects were almost negligible with three trials reporting five cases of heartburn and one trial reporting two cases of indigestion in the garlic group and one case in the control group. This study clearly shows that garlic consumption has a positive effect in controlling total cholesterol and LDL levels and also in raising HDL levels in around 12 weeks. Dispensing Garlic Supplements along with Diabetes Medications 60 patients diagnosed with diabetes mellitus were split into two groups of 30 each. Those in group 1 (GR1) were given garlic tablets at a dose of 300 mg thrice a day and patient in group 2 (GR2) were given a placebo. Patients in both the groups received metformin tablets at a dosage of 500 mg twice daily apart from the garlic or placebo medication. All the patients were asked to come with 12 hours fasting for lipid profile and fasting blood sugar analysis at week 0, week 12 and week 24 respectively. All other medications were not allowed during the study period and the patients were constantly motivated and monitored for their compliance with healthy lifestyle measures such as regular exercise and diet. Results showed that there was a significant reduction in fasting blood glucose levels in group 1 compared to group 2. Mean age of participants in GR1 was 40 years and in GR2 it was 35 years. One patient in GR1 reported heart burn and consequently left the study, two patients in GR1 and three patients in GR2 were also dropped as they did not come back regularly for monitoring their blood glucose levels, 17 patients in GR1 and 18 patients in GR2 were diagnosed with concurrent dyslipidemia. GR1 showed significantly lesser mean glucose levels and fasting blood glucose levels too. Mean total cholesterol, LDL and triglycerides reduced greatly in GR1 compared to GR2. There was a significant increase in HDL after 12 weeks of study. Effect of Garlic Pills on Pregnant Women Nowadays, pregnant women with diabetes (gestational diabetes) is a common occurrence. Borderline gestational diabetes mellitus (BGDM) is associated with higher chances of caesarian deliveries, preterm birth, macrosomia, preeclampsia, neonatal hypoglycemia and stillbirth. Effective treatment methods for gestational diabetes mellitus (GDM) or BGDM include diet, physical activity and maintaining a normal body weight. Owing to inappropriate eating habits and sedentary behavior we do see a steady increase in the number of pregnant women with gestational diabetes and according to WHO reports, more than three-quarters of the population in developing countries use herbal medicines as their numero uno choice and one-third of diabetes-affected individuals use effective alternative medicines such as garlic. After imposing multiple selection criteria, the final sample size was down to 44 participants each of whom were assigned to the intervention (garlic) or control (placebo) group. The average age of these women was 29.6 years, most were housewives, 56% women were pregnant with their first baby and 90% had no history of abortion. Every participant received 1 pill (either garlic or placebo pill) every day after meals for 8 weeks. While the garlic pill contained 400 mg of dry garlic powder the placebo pills contained starch but giving the same appearance as the garlic pill. Results showed that:
References Effect of Garlic Supplement in the Management of Type 2 Diabetes Mellitus: A Meta-analysis of Randomized Control Trials: https://foodandnutritionresearch.net/index.php/fnr/article/view/1230/4530 Garlic Supplementation with Standard Antidiabetic Agent Provides better Diabetic Control in Type 2 Diabetes Patients: https://www.researchgate.net/publication/51682026_Garlic_Allium_sativum_supplementation_with_standard_antidiabetic_agent_provides_better_diabetic_control_in_type_2_diabetes_patients Effects of Garlic Pill on Blood Sugar Glucose Level in Borderline Gestational Diabetes Mellitus: http://ircmj.com/en/articles/60675.html The world is witnessing an obesity epidemic which is mainly related to our consumption of foods. Worldwide obesity rates have almost tripled since 1975 with almost 39% adults aged 18 years and over suffering from overweight issues and 13% suffering from obesity as of 2016. Obesity in children is also rapidly on the rise with almost 1 in every 5th child suffering from overweight issues and almost 50% of these children live in Asia. The irony here is that we have reached this threshold despite obesity being a preventable disease. Its not like we are all blind to the obesity epidemic and there are actions taken from all sides-the government, people and physicians to control it but the problem only seems to be growing more and more. Preventing and treating obesity remains on top of the list for a better future generation who would otherwise suffer from chronic illnesses and debilitating diseases right from their young age. We need innovative and feasible ways to help people moderate their consumption of healthy food, manage energy balance (calories consume vs calories expelled) and lose weight in a healthy and sustainable manner.
The current trend is junk food consumption which has attained new heights with latest innovations. These foods are nothing but high in simple sugars and saturated fats with negligible nutrition. A donut might seem small but the calorie content in it is large. When we munch one during our snack time, we tend to ignore it in our daily total calorie consumption. Its not good enough to believe that dieting in our own style or relying on our so-called willpower will help us overcome consumption of junk or ensure portion control. Weight management and weight loss depend on proper nutrition intake and management of calorie intake else. Else, if we continue at this present pace the day is not far off when every other person living is either overweight/obese faced with life-threatening health problems and well-being issues. Our eyes deceive us and our hearts feel for us and we make mistakes calculating our calorie intakes or in figuring out where we are going wrong in trying to lose weight despite our dieting regimens. The invention patented here exactly addresses this problem thereby helping any individual monitor and control his/her intake of foods and nutrients. It also stands tall in the sense that it helps a person reduce his/her consumption of junk foods and their intake quantity too. Invention The invention is based on the concept of a wearable device that measure’s a person’s food consumption based on the interaction between light energy and the person’s body. This wearable device can be a finger ring, smart watch, wrist band, armlet, cuff, sleeve or wrist bracelet. The device comprises of the following:
On a comparative note, the technical challenges of identifying consumption of selected types of foods, ingredients and nutrients is much more than the challenges of identifying which types are healthy or unhealthy. The selected ingredient or nutrient is estimated indirectly using a database that links common types and amounts of foods with common types and amounts of ingredients or nutrients. The device does not rely on estimates from a database but does require more complex ingredient-specific or nutrient-specific sensors. There are many individuals who consume ultra-processed foods whose main ingredient is sugars. In these foods, the sugar content is mostly hidden or disguised in the form of labeling it as ‘cane sugar’ or ‘100% natural’ but in reality, they are not good for the body and the device here isn’t fooled by these fancy labelling terms and the ingredients. The device here also caters to the needs of people allergic to certain foods, excludes those deemed as ‘unhealthy’ by the user’s physician and also has the potential to analyze food composition to identify one or more types of foods whose consumption is prohibited or discouraged for religious, moral and cultural beliefs. The volume or quantity of food consumed is estimated by analyzing one or more pictures of the food. The volume might be calculated by using a physical or fiduciary marker such as a plate, utensil, or an item of a known size. Otherwise, the food scale might be used to measure the weight of food prior to consumption and the weight of unconsumed food remaining after consumption to estimate weight of food consumed based on difference in pre vs post consumption measurements. The device monitoring food consumption might comprise of a wearable sensor that is configured to be worn on a patient’s wrist, hand, finger or arm and the sensor corrects data that is used to detect probable eating events without requiring action by the person in association with a probable eating event apart from the act of eating; a smart food utensil, probe or dish that collects data which is used to analyze the chemical composition of food that the person eats; a data analysis component where this component analyses data collected by the food utensil, probe or dish to estimate the types and amounts of foods, ingredients, nutrients and calories that are consumed by the person and, this component also analyzes the data collected by the sensor and food utensil for getting a clear account of the individual’s total food consumption. This spectroscopic device is not the go-to device for relying 100% on all your required good nutrition and weight management but it does aid the individual in encouraging good nutrition, weight management, energy balance and overall health. The patent was published on March 17th, 2016 and for detailed description of the patent please refer: United States Patent & Trademark Office: http://patft.uspto.gov/netacgi/nph-Parser?Sect1=PTO2&Sect2=HITOFF&p=1&u=%2Fnetahtml%2FPTO%2Fsearch-bool.html&r=1&f=G&l=50&co1=AND&d=PTXT&s1=%22wearable+spectroscopic+sensor%22&s2=%22measure+food+consumption%22&OS= World Intellectual Property Organization: https://patentscope.wipo.int/search/en/detail.jsf?docId=US160392400&_cid=P22-JY8GAI-73892-1 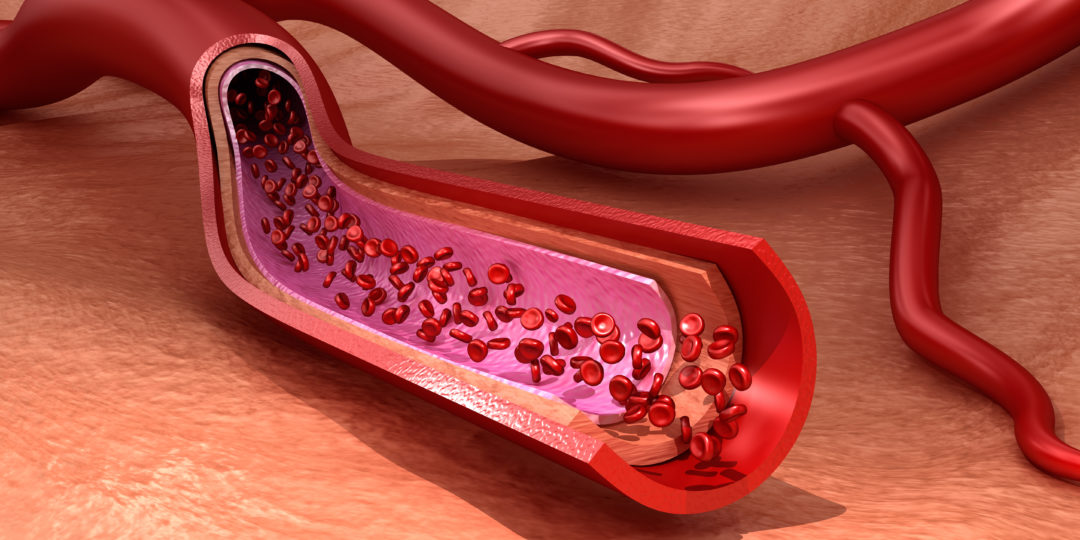 Endothelial Dysfunction is the First Step of Atherosclerosis & Certain Other Diseases We have complicated lives by simplifying lifestyles. Walking has become only an exercise and shopping has become mostly Internet-based. Curtain blinds, cooling sheets and air-conditioners invoke the pleasures of staying inside, advancements help us get things delivered to the doorstep-right from groceries and meals to beauty services and yoga classes. There exists not much need to meet Mr. Sunshine and say hello to the glowing sun that helps in producing vitamin D endogenously in the skin upon exposure to its rays. Besides, we can count the meagre number of foods that are excellent sources of this vitamin. All these make most of us deficient in vitamin D which opens the doors to multiple complications and problems in life. This is no exaggeration, but we see teens and young adults having negligible amounts of vitamin D in their body thereby suffering from joint problems and lack of energy. The effect of vitamin D in bone health and calcium homeostasis is widely known- hypovitaminosis D is a major contributor of osteoporosis owing to failure of calcium absorption, secondary hyperparathyroidism and increased bone resorption. But now, we see vitamin D being increasingly linked to other health conditions such as obesity, cardiovascular disease, type 2 diabetes, cognitive effects, hypertension, myocardial infarction, cardiovascular death and total mortality rates. But is vitamin D linked with endothelial function? Vitamin D and Endothelial Function The endothelium once thought of simply having no functionality beyond allowing water and electrolytes permeability has become one of the most important endocrine organs. Vascular endothelial cells are found throughout the circulatory system responsible for fluid filtration in the glomeruli of the kidneys, homeostasis and neutrophil recruitment. Endothelial cell response is involved in various disease processes such as atherosclerosis, hypertension, pulmonary hypertension, sepsis and inflammatory syndrome. All these diseases are linked to endothelial injury, dysfunction and activation. Endothelial dysfunction is an early event in cardiovascular disease that has now become simpler to diagnose. Earlier, an invasive procedure was used where artery catheterization was necessary to assess endothelial dependent vasodilation. It is characterized by a shift in the actions of the endothelium toward reduced vasodilation, a proinflammatory state and prothrombic properties. Normally, the endothelium helps in regulating blood clotting, immune response, controls volume of fluids and electrolytes that pass from blood to the tissues and produces dilation or constriction of blood vessels. But with the presence of endothelial dysfunction the ability to perform one or more of these functions is affected. It’s also been believed that endothelial dysfunction plays a prominent role in laying the foundation for atherosclerosis, vascular leakage, infectious diseases and stroke and is mainly caused due to diabetes, metabolic syndrome, hypertension, smoking and sedentariness. Vitamin D has been linked with cardioprotective properties especially through its action on the endothelium. But the mechanism in which vitamin D might affect atherosclerotic process has not been completely understood. It might be due to increased nitric oxide (NO) production, reduced oxidative stress, decreased interleukin 6 (IL-6) expression or vascular cell adhesion molecules (VCAM) and intracellular adhesion molecule (ICAM). Vascular expression of NF-κB was more in individuals with vitamin D deficiency and endothelial expression of IL-6 was also higher in vitamin D deficient patients. Still, the effects of vitamin D supplement consumption on endothelial function is not yet clear. A meta-analysis on the impact of vitamin D supplement on endothelial function is discussed below: Meta-analysis of Vitamin D Supplement on Endothelial Function Preferred reporting items for systematic reviews and meta-analysis (PRISMA) guidelines were used and multiple databases include PUBMED were searched. While the search came up with 213 citations finally only 12 studies were eligible for inclusion in the meta-analysis. Each of the studies had between 34 and 114 participants, two studies had only female participants and other studies had between 14% and 84.1% women, mean age of participants was between 29 and 67 years and each of the studies included various vitamin D supplement doses. Study findings suggest that vitamin D supplementation might improve vascular function. A double-blind placebo study on 34 patients showed that a single dose of 100000 IU vitamin D2 supplement versus placebo increased flow-mediated dilation (FMD) in 8 weeks of follow-up. Another study examining the effects of vitamin D3 (3,00,000 IU) supplements for 3 months in vitamin D-deficient individuals also showed an increase in FMD levels. Another study that administered two different levels of vitamin D (1,00,000 IU and 2,00,000 IU) and placebo in 61 patients at 8 and 16 weeks showed no difference in FMD for the vitamin D group. Researchers have discovered vitamin D receptors in several cell types including vascular smooth muscle cells, endothelial cells and cardiac myocytes. Vitamin D synthesis by endothelial cells helps in regulating impact of inflammatory cytokines on the vasculature and studies do support the fact that vitamin D supplementation can have a positive effect on FMD and reduce risk of cardiovascular disease. Vitamin D’s Impact on Endothelial Dysfunction on Patients with Chronic Kidney Disease Chronic kidney disease (CKD) affects almost 10-15% of population impairing their health and economy of both, the patient and the society. The tricky point here is that CKD doesn’t result in death due to renal failure but most of the times due to cardiovascular events. Many CKD patients usually suffer from vascular disease and endothelial dysfunction from early stages which is followed up by marked vascular stiffening and arterial calcification. There have also been concerns that vitamin D compounds might cause deterioration of renal function but we don’t have much studies on vitamin D’s effect on CKD patients. A meta-analysis was conducted as per PRISMA guidelines and randomized control trials were included. Patients with CKD given vitamin D supplements were the intervention group and the placebo group included those who received no treatment. Outcomes were restricted to flow mediated vasodilation (FMD). FMD is mainly a measure of the capacity of the endothelial cells to produce nitric oxide (NO); it is a measure of function and not structure which makes it an early sign of vascular disease and a predictor of cardiovascular risk. Database search using specific search criteria resulted in a total of 1744 articles and after further screening only 14 articles were selected for full review of which 4 studies met full inclusion criteria. Each of the studies had between 24 and 120 participants and study duration was between 12 and 16 weeks. All the patients were between 44 and 65 years of age and in stage 3 or 4 of CKD. A total of five studies with 305 participants were evaluated and none of them showed difference in FMD measures at baseline between the intervention and the placebo group. Chitalia et al showed positive effects of dispensing vitamin D (3,00,000 IU) given as two doses at the beginning and at 8 weeks during a 16-week trial; Kendrick et al compared cholecalciferol 2000 IU with calcitriol 0.5 μg daily for a period of 6 months but could not detect any changes in FMD. Favorable effects were seen in both, fixed and random model studies, supporting the fact that vitamin D is advantageous on endothelial function. Also, maximum benefits were seen on younger patients as they were mostly in the earlier stages of the disease. Effect of Vitamin D on Endothelial Function: Placebo-controlled Trial We do very well know that overweight and obesity are serious risk factors for development of hypertension and CVD apart from vitamin D deficiency. Also, excess fat increases the risk of vitamin D deficiency and is also associated with endothelial dysfunction, a precursor to hypertension. So, a randomized placebo-controlled trial was conducted to determine the effect of vitamin D supplementation on endothelial function on obese/overweight individuals with vitamin D deficiency. Though a total of 489 individuals were initially screened only 93 of them were finally included-46 received ergocalciferol and 47 received placebo. But finally only 84 participants (43 assigned to ergocalciferol and 41 assigned to placebo) completed the study whose mean age was 37 years and mean BMI was 33.9. Results showed that:
The various studies and meta-analysis show that the evidences supporting the effect of vitamin D on endothelial function is conflicting. Yet we are sure that a majority of the population suffers from vitamin D deficiency which needs to be addressed. Hence, make way for some sunshine in your life to make your day brighter and your health better. References The Impact of Vitamin D Supplement Intake on Vascular Endothelial Function: A Systematic Review & Meta-analysis of Randomized Control Trials: https://foodandnutritionresearch.net/index.php/fnr/article/view/1145/4405 Treating Endothelial Dysfunction with vitamin D in Chronic Kidney Disease: A Meta-analysis: https://www.ncbi.nlm.nih.gov/pmc/articles/PMC6156877/ Effect of Vitamin D on Endothelial Function: https://academic.oup.com/ajh/article/30/2/124/2525927  Foods Rich in Vitamin D are Few & Hence, Vitamin D-deficient People are Many 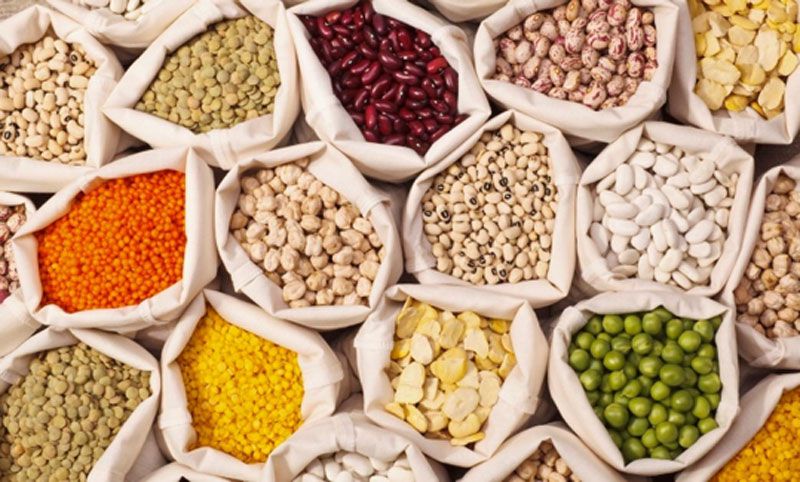 Choose Your Pulse on an Impulse to Bring Down Blood Glucose Levels Carbohydrates are one of the macronutrients along with proteins and fats required for survival of the human population. But this poor thing has been rolled and tossed by people who adore it or sometimes loathe it to the extreme that they cut off its intake to the maximum extent possible. One main reason for hating the macronutrient and succumbing to fad diets that boast of low-carb foods is weight loss. If you think deeply, carbohydrate is the only macronutrient that does not have an established minimum requirement. Even our ancestors who hunted and gathered food primarily depended on animal and plant foods including fruits, honey and starchy foods that were rich in carbohydrates. While we have so much to boast about this macronutrient why do many people in our society keep despising it? Carbohydrates are the only ones that directly increase our blood glucose levels but we have studies showing that the total amount of these nutrients as a percentage of dietary energy is less critical than the type of this nutrient consumed for risk of any chronic disease including diabetes. For example, potatoes, sugar-sweetened beverages and refined grains are usually associated with increased risk of diseases while legumes, fruits and minimally processed grains are associated with reduced risk of the disease.
The food’s effect on our body’s blood sugar levels can be indicated with two measures: glycemic index (GI)and glycemic load (GL). GI value helps in comparing foods depending on the standardized amount of carbohydrates (values are assigned depending on how slowly or quickly the particular food will raise blood sugar levels) while GL allows to get a better prediction of how much the food will raise a person’s blood glucose level after eating it and it also takes into account the amount of carbohydrates present in a portion of food. GL is much more helpful in predicting glycemic response than the amount of carbohydrates, proteins and fats in foods. We have studies showing that higher GI or total GL is a serious risk for type 2 diabetes in both men and women. Type 2 diabetes incidence rates have multiplied greatly in recent decades promoting it as an epidemic. This chronic disease spares none and even small kids are affected by juvenile diabetes (type 1 diabetes). While type 2 diabetes is genetic this does not imply that all those who have a family history of diabetes are sure preys to the disease and those who don’t have a family history will never acquire it! Ultimately, the risk revolves around your lifestyle practices which play prime roles in determining your course of health including risk of diabetes. Such predominance among the worldwide population necessitates the need for immediate prevention and management techniques and current research studies are focusing on interventions involving dietary modifications as diet has always been the go-to solution for diabetes management. There are even millions of those in prediabetes stage where their blood sugar levels are higher than normal but not high enough to be termed as a diabetic. While some of them resort to taking medications even during this stage most physicians suggest lifestyle changes as the first measure towards controlling blood sugar levels. For diabetes patients too, medications are simply not enough to keep glucose levels under control. They need to bring in appropriate diet changes and ensure to practice some physical activity, preferably walking, to keep diabetes under control. Reducing postprandial blood glucose response (PBGR) is needed to achieve glycemic control and this is the first aim of any dietary intervention to avoid risks of complications from hyperglycemia. Eating Foods for the Cause of Favor Instead of Flavor Its not new to hear advices strewn across the Internet, neighbors giving free consults or family members assuming a doctor’s position recommending diabetes patients to eat more of certain foods, avoid certain foods and restrict some others. Sweets are unanimously voted against eating; wheat is always promoted and fruits have been bounced and kicked around as they have contradictory results. Mangoes, sapodillas, grapes and jackfruits have always been resisted by diabetic patients as they have the tendency to increase blood sugar levels spontaneously but there are some who avoid taking any of the fruits fearing altered sugar levels. This is an entirely different stream that needs proper channelizing but one thing is clear-fruits are not enemies of diabetes. Controlling portion sizes and incorporating fruits in accordance to your daily diet routine is the key. Generally, dietary interventions are primarily focused on foods with a low glycemic index (GI) and we have epidemiological studies linking low GI or low GI diets with reduced risk of developing diabetes. Whole grains, vegetables and fruits are generally included as a part of the diet for people with diabetes as these have a low GI index and another food that stands out above the rest of these include pulses that not only contain low GI but also have other benefits such as high amounts of dietary fiber, low amount of fat, high levels of micronutrients, proteins and easily digestible carbohydrates. Pulses, the dried seeds of legumes (beans, lentils, chickpeas etc.) have always been promoted as an indispensable part of a healthy meal as it is touted to improve nutrition and health outcomes. We do have numerous studies showing the benefits of pulses consumption in reducing type 2 diabetes (T2D) risk. A review of 41 controlled clinical trials showed that pulses were associated with improvements in markers of long-term glycemic control irrespective of whether or not it was consumed alongside a low-GI, high-fiber diet or regular diet. Other studies too have always focused on the effects of pulses with a high-GI, starchy control food which surely does help in reducing PBGR but the magnitude and consistency of their effects and also the exact portion required to lower PBGR remain unknown. Also, we do know that all pulses do have a certain amount of PBGR lowering quality but again, we do not know if the effect is consistent across all. Lentils have shown promising effects in great many studies and the study discussed below assessed the PBGR-lowering effect of cooked lentils in a mixed meal that included high-GI foods. Here, half of the carbohydrates from high-GI foods were replaced with cooked lentils in a mixed meal. The study was formulated with the main aim of comparing PBGR and relative glycemic response (RGR) following meals consumed with starch-rich foods alone and in combination with cooked lentils too. Letting Lentils Tell You About their Fellowship with Diabetes Th study included healthy participants aged between 18 and 40 years with a BMI of 20-30 who were split into two separate groups. Both the groups attended a total of five 3-h morning study visits separated by a 3- to 7- d washout period. The treatment included providing 50 g available carbohydrates (AC) based on glycemic carbohydrates (total starch and free sugars) and proximate analysis. The analysis was performed on raw foods to avoid conflicting results due to moisture content present after cooking but analyses done before and after cooking showed that there was no difference in total starch, free sugar and resistant starch. Treatment options were of two types-it either included consuming white rice/white potato alone or consuming white rice/white potato in combination with 3 different varieties of lentils (large green, small green and split red lentils). The foods were prepared according to designated protocols with the necessary amount of water. The meals were consumed within 10 minutes of preparation with 250 mL of bottled water with the exception of cooked potato where the participants were allowed to drink as much water as they wished. The participants arrived for every study after a 10-12-h overnight fast, avoiding alcohol consumption, performance of unusual physical activity, OTC medications or consuming pulses for 24 h prior to study and consumed the same meal (of their choice) for dinner the previous evening. Height, weight, blood pressure and waist circumference were measured at each study. Blood samples were collected at fasting and 15, 30, 45, 60, 90 and 120 min after the first bite of the study treatment using which glucose levels were analyzed. 26 participants were assigned to rice group and 25 participants to potato group. But finally, only 24 participants remained in each group due to impaired glucose tolerance results in the eliminated participants. Average age of participants in both groups was around 27 years and BMI reading was around 24. 11 participants completed the rice and potato treatment. Results showed that:
Effect of Replacing Meals in Obese/Overweight Subjects Low GI foods have also been promoted for weight loss but studies are not conclusive. The following study attempts at altering both GI and amount of carbohydrates in well-defined mixed meals to find out glucose and insulin response in overweight/obese participants over the course of a 12-h day. Participants aged between 18 and 70 years who were devoid of chronic diseases, had a BMI reading of 25-35 and fasting serum glucose levels ≤125 mg/dL participated in the study. All participants were assigned to one of the four diets (high GI, high carbohydrate [HGI-HC]; high GI, low carbohydrate [HGI-LC]; low GI, high carbohydrate [LGI-HC]; and low GI, low carbohydrate [LGI-LC]) with at least a 3-day washout period in between diets. For every diet period all of them were fed a standard American diet consisting of 34% fat, 15% protein and 51% carbohydrates for 3 days prior to test days. While breakfast and dinner were consumed at the test center, lunch was provided as a takeout. All of them were given 20 minutes to consume the meal and were requested to finish all the foods provided. Menu was formulated for four isocaloric diets that differed in GL by manipulating GI based on white bread values and percent energy from carbohydrates. The meal consisted of mixed foods and energy from protein was maintained at 20%. On the fourth day after a 10-h fast blood samples were collected from all the participants just before breakfast and at regular intervals thereafter (at 15, 30, 45, 60, 90, 120, 150 and 210 min) for 12 h. Participants were asked to rate their hunger level between 0 and 100 with 0 defining ‘I am not hungry at all’ and 100 defining ‘I have never been more hungry’. Results of 26 participants (10 males and 16 females) who completed the study showed that:
References Carbohydrate Replacement of Rice or Potato with Lentils Reduces the Postprandial Glycemic Response in Healthy Adults in an Acute, Randomized Trial: https://academic.oup.com/jn/article/148/4/535/4965930 Reducing the Glycemic Index or Carbohydrate Content of Mixed Meals Reduces Postprandial Glycemia & Insulinemia Over the Entire Day but Does not Affect Satiety: https://care.diabetesjournals.org/content/35/8/1633 Dietary Carbohydrates: Role of Quality & Quantity in Chronic Disease: https://www.bmj.com/content/361/bmj.k2340 Weight Loss Maintenance: Weekends Are Not a Time to Resist but to Exist Peacefully with Food8/22/2019
 Relax & unwind during Weekends: Don’t Overdo your Dieting Routine  A Cheat Meal Once a Week or a Fortnight is not a Sin A Cheat Meal Once a Week or a Fortnight is not a Sin We are not in shortage of fad diets, weight loss programs, fitness centers and supplements to facilitate weight loss in individuals. Obesity has become a worldwide epidemic paving way for numerous chronic disease such as diabetes, cardiovascular disease and cancer. A disease that was restricted to the upper-class people and developed countries decades back it has become even more prevalent in developing countries, especially in urban settings. Obesity and overweight develop over time when the total calories consumed exceed the calories burned. Such energy imbalance causes the body to store fat. BMI ranges help categorizing people into various categories-those with a BMI ≥25 is termed overweight and those with BMI values ≥30 are obese.
A well-balanced diet, regular physical activity and an active lifestyle are certainly important for staying on a normal weight range. Overweight/obese people trying to lose weight can approach registered dietitian nutritionists for a healthy weight loss chart. A modest weight loss treatment helps individuals lose around 0.5-1.0 kilogram every week. Even a 5-10% decrease in body weight is beneficial for the individual in terms of his/her health quality and well-being. Research shows that most of the weight loss programs help individuals lose at least 10% of initial body weight over 30 weeks. The process is not tedious but needs patience and perseverance. Once the candidate loses weight, he/she is extremely happy but if the person goes back to his/her same old routine involving junk foods and sedentary lifestyles weight regain is inevitable. Helping individuals lose weight and keep it off is an even greater problem. Of all the individuals who lose weight only some are able to lose weight and also maintain the weight loss over a long term. Long-term weight loss maintenance (LTWLM) remains a key challenge and even though a vast portion of the population is trying to lose weight only 17-23% are able to maintain the weight loss. Getting to know those individuals who are successful in LTWLM, monitoring their behavioral changes and lifestyle can help in developing better intervention methods to support others in maintaining weight loss. Higher levels of physical activity, self-monitoring weight and working out on achieving self-established goals are some of the behavioral strategies used by those who are successful in maintaining their lost weight. The US National Weight Control Registry (NWCR) has been constantly updating individuals with the weight loss maintenance over the last couple of decades. The Portuguese Weight Control Registry (PWCR) is another voluntary registry that has enabled individuals to lose 5 kg weight and maintain the weight loss for at least 1 year. Influence of Weekdays/Weekends on Weight Loss Maintenance Weight loss is indeed a taxing process as we are asked to forego many of the processed foods that satisfy our cravings and taste buds. Gone are the pizzas, khakras, butter biscuits, mithais and chips. In comes the fruits and vegetables. There is a cheat meal that’s allowed once every week in most programs but this does not guarantee that the individual is mentally satisfied with the way he/she consumed food. As of now, we don’t have much evidence on how the diet’s strictness during weekdays and holidays influence long-term weight loss maintenance. But logically, it seems better when we do follow a flexible dietary pattern during weekends and public holidays as this helps us break the monotony, avoid boredom and allow a more realistic approach from a long-term perspective. At the same time, we are paving way for greater chances of loss of control over the diet and deviation away from the goal. We even have research evidence showing that participants who followed the diet on weekends and holidays too had 1.5 times more chances to maintain their weight loss compared to those who skip the diet routine during these special days. The study below aims to understand the consequences of dieting during weekends and holidays comparing to weekdays and the influence it would have on weight loss maintenance in a Portuguese sample of people who were successful in weight loss maintenance. A total of 108 participants were included in the study from the PWCR with the criteria that all of them were between 18 and 65 years of age and had maintained their 5-kilogram weight loss for over a year irrespective of their initial body weight. At the PWCR, all the participants were given a questionnaire asking to fill their weight history, weight loss and weight maintenance behavioral strategies. Some of the questions asked were:
Long-term Weight Loss Maintenance in United States The sample size for the study included 14,306 individuals who were selected based on different criteria. Only those whose BMI was not under 25, whose age was neither below 20 nor above 84 and those who had lost weight a year ago and managed to maintain all or some of it were included in the study. The male-female ration was almost equal in the study, 32% reported being in good health, 29.9% reported very good health and 19.5% reported excellent health. Surprisingly, weight loss was a goal only for 1/3rd of the participants despite the fact that almost 82% of them were overweight or obese. Results showed that:
Yet another study showed that weight gain was prominently seen after weekends mostly on Sundays and Mondays and gradually decreased as the week progressed. Changes in weight during weekends is quite logical as most individuals party out or eat junk which automatically increases their chances of weight gain. At the same time, stressing too much overweight changes, being too conscious of every morsel consumed even during weekends and starving yourself is not going to work out. Have a balance, eat just right, don’t overdo portion sizes, exercise daily and keep checking your weight often to keep your LTWLM goal in check. Allowing more flexibility and going easy during weekends and holidays is the best approach as it is realistic and also successful in the long term than sticking to a strict diet plan and losing focus halfway through. Reference Does diet strictness level during weekends and holiday periods influence 1-year follow-up weight loss maintenance? https://nutritionj.biomedcentral.com/articles/10.1186/s12937-019-0430-x Weight Increases during Weekends & decreases during weekdays: https://www.karger.com/Article/FullText/356147 Long-term weight loss maintenance in the United States: https://www.nature.com/articles/ijo201094?source=your_stories_page---------------------------  Lifestyle can Impact Pregnant Woman’s Gestational Diabetes Risk  Moms, Save Your Kids The Risk of BP by Staying Healthy Before & During Pregnancy Moms, Save Your Kids The Risk of BP by Staying Healthy Before & During Pregnancy Pregnancy brings about joy and happiness in the family. But as the news sets in, the couple and the entire family become concerned about the forthcoming journey until delivery working hard for a healthy pregnancy tenure and the delivery of a healthy baby. No time is too late for starting to lead a healthy life but the sooner, the better! Gearing up for pregnancy by becoming fit and healthy even before conceiving is the best way to safeguard against pregnancy complications but not many women follow this policy. While normal-weighted women may face pregnancy-related complications during the pregnancy course the risks are even higher for overweight/obese women. Obesity-related health conditions such as cardiovascular disease, chronic kidney diseases and type 2 diabetes are becoming more prominent with the ever-increasing obesity epidemic.
Hyperglycemia is the commonest metabolic disorder that paves way for aplenty pregnancy complications. Gestational diabetes mellitus (GDM) is any degree of glucose intolerance that’s first identified or whose onset happens during pregnancy. It also includes the possibility that glucose intolerance could have started the same time as pregnancy and almost 7% of pregnant women face this complication during their pregnancy. The prevalence rates are between 1 and 14% depending on the population. GDM is usually detected at 24 to 28 weeks of gestation on the basis of elevated plasma glucose levels on glucose tolerance testing. There is an increase in supply of glucose from the mother to her fetus during fetal growth and development. This stimulates the pregnant mom to develop insulin resistance to enable mother-fetus passage of glucose. There is not much of a change in insulin resistance during the first or second trimesters. But midway through the second trimester insulin requirements increase by 2.0- to 2.5-fold to optimize blood glucose levels of the pregnant mother and keeps her away from hyperglycemia. GDM is a condition that occurs when maximal insulin secretion cannot match the degree of insulin resistance. Hyperglycemia during pregnancy can have debilitating effects on the mother and the fetus increasing the risk of hypertension, pre-eclampsia, pre-term deliveries, macrosomia, fetal trauma, fetal hypoglycemia and low Apgar score. But the relationship between maternal GDM and the offspring’s risk of hypertension has been inconclusive. We have studies showing that offspring of moms with GDM had higher mean values of systolic blood pressure (SBP) or diastolic blood pressure (DBP) than children of those without GDM. Certain other studies showed no difference in BP readings between those with/without GDM. Large-scale Study on the Risk of Hypertension in Kids whose Mothers Suffered from GDM The study happened in China which included 578 non-GDM mother-child pairs and 578 children of mothers with GDM. All basic information about the mothers and their children were collected in the form of questionnaires. Height, weight, BMI and blood pressure measures were taken of all the participants involved in the study. In accordance with WHO guidelines, children’s BMI was classified as normal weight when BMI <85th percentile, overweight when BMI was >85th percentile and <95th percentile, and obese when BMI>95th percentile. Blood pressure measurements were declared to be high when SBP and/or DBP ≥90th percentile but <95th percentile in kids. Kids were called hypertensive when SBP and/or DBP ≥95th percentile. All analyses were adjusted for maternal age, gestational age, education, current smoking and treatment of GDM; kid’s outdoor activity time, vegetable and fruit intake frequency, screen watching time, sleep time and Z score for BMI-for-age. Mothers with GDM were older at the time of delivery, had higher pre-pregnancy BMI and also had less weight gain during pregnancy compared with women without GDM. They also had a higher birth weight, higher Z score for BMI, less sleeping time and were mostly overweight/obese compared to kids of mothers who did not have GDM. The mean value of age of the kids involved in the study was 5.9 years. Results showed that:
In Utero Exposure to Hyperglycemia Increases Risk of Blood Pressure Later in Life The study here analyzed the relationship between maternal GDM, offspring adiposity and systolic blood pressure at the child’s three years of age. A total of 1,238 mother-child pairs were involved in the study where the mothers were generally older and had a lower mean pre-pregnancy BMI. All of the women were tested for GDM and those who tested positive were suggested to meet a nutritionist who corrected their diet, exercise and checked on their fasting blood sugar daily. The child’s blood pressure readings were taken five times during a single visit. 1,020 infants had 5 measurements, 62 had 4, 28 had 3, 30 had 2 and 33 had 1 for a total of 5,525 measurements. The study used only systolic blood pressure readings and not diastolic pressure readings to predict later occurrence of blood pressure. Mother’s pre-pregnancy weight and height, paternal weight and height, smoking status, household income, paternal hypertension, history of diabetes, presence of GDM in the mother’s mother and paternal height and weight were noted down in the form of a questionnaire. Mean maternal age was 32 years and BMI 24.6. It was observed that 51% mothers suffered from GDM and an additional 152 (12%) of them from impaired glucose tolerance (IGT). It was also seen that these mothers were older and had higher pre-pregnancy BMI and pregnancy weight gain compared to those without GDM. Also, these moms mostly had a family history of DM and GDM. At 3 years, children of those mothers with GDM had higher systolic blood pressure compared to those whose mothers did not suffer from gestational diabetes, almost 3.2 mmHg higher. Maternal IGT did not affect offspring blood pressure in any way. Generally, woman with overweight/obesity, those who don’t do much physical activity, lead a sedentary lifestyle and have a family history of diabetes or moms with GDM are at a greater risk of suffering from GDM during pregnancy. Hence, every woman in her reproductive age is suggested to lead an active lifestyle that helps her maintain a healthy body weight and remain devoid of any health issues to sail through pregnancy smoothly and deliver a perfectly healthy baby. Though the relationship between maternal GDM and infant high blood pressure might seem inconclusive it is sure that those with maternal GDM are in for pregnancy related complications and high blood pressure in infants is also one of those. References Maternal Gestational Diabetes is Associated with Offspring’s Hypertension: https://academic.oup.com/ajh/article/32/4/335/5281125 Gestational Diabetes and the Offspring: Implications in the Development of the Cardiorenal Metabolic Syndrome in Offspring: https://www.karger.com/Article/FullText/337734 Intrauterine Exposure to Gestational Diabetes, Child Adiposity & Blood Pressure: https://www.ncbi.nlm.nih.gov/pmc/articles/PMC2761640/ Music is medicine for many of us in times of loneliness, stress, distress, failure and setbacks. It is also a way to express our joys and happiness in life. Research has it that we love to listen to different kinds of music-peppy songs when we are in joy, emotional ones when sad or motivating ones in times of failure-depending on our moods and there are studies supporting and denying the fact that music improves cognitive abilities of the brain. Rather than the user trying to search for songs that suit his/her mood how good would it be when a system recommends a list of songs depending on our current emotional state? Extremely helpful putting us in the right frame of mind! The patent invented here is an intelligent music system that suggests a playlist of songs depending on our emotional state of mind.
The system designed here has at least one bio-signal sensor that’s configured to capture bio-signal sensor data from at least one user. Bio signals are signals that are generated by biological beings that can be measured and monitored. Human brains generate bio-signals such as electric patterns that are measured or monitored using an EEG. The system provided here is one with a database that’s built of a user’s EEG response to certain musical streams. Along with additional information such as the user’s preferred music genre, personality questions and demographic information the system recommends a personalized music list which is solely based on the user’s emotional state and the desired state of the user. Hence, the system designed here responds with a particular music or song depending on the emotion experienced by the user and the system might even start playing the music instantly. While the user has access to many songs in the database there might be scenarios in which user does not have access to play certain music and the system might suggest ways in which the song might be accessed (through purchase or third-party service). The music and the bio-signal database of songs and emotions might be stored in a local computer or on multiple servers (such as in the cloud). Music is universal and there are no language barriers to love it. People listen to music with different goals in mind-to surpass boredom and be attentive while studying or driving, influence their emotional state with a goal of achieving a desired mood state such as happiness, excitement and sadness or to involve pleasure generally. Users might also be questioned to determine the type of person he/she is and the type of music the person would prefer listening to. Questions asked might include: Think of a song that makes you feel sad; What was your favorite song when you were in love? Think of a song that makes you feel like dancing. Individuals might respond with answers such as: I love sad music or I hate sad music, I work harder than what others think, I’m an emotional person or I don’t get emotional about things, I am slightly shy or I love hanging out with friends. Such questions and answers are additional data that don’t simply rely on the EEG data alone. But the present invention goes beyond asking questions that help judging a personality-it uses bio-signal data and the invention adds EEG data of the user as additional training data to songs that have been labelled as evoking a particular emotion either through the user reporting the emotion via any of the questions or statements above or by tagging a song manually. The type of song we like to hear depends on us. Some of us listen to sad songs when we are sad while some others listen to happy songs when sad. Intense emotional music releases dopamine in the pleasure and reward centers of the brain just like the effects of food, drugs and sex. This makes us feel good and repeat the behavior. Likewise, more the emotions a song provokes greater is our interest in listening to the song. Some also cry to let off stress and elevate mood. The present invention also determines the user’s emotional response after some time (maybe after 5 seconds) once the music starts to play. The user’s emotional response is fetched throughout playback of the song and the response is associated with the playback position of the song. While EEG might not be the one-stop solution for recognizing all the emotions it is still extremely good at noticing changes in the brain’s state. EEG measures a series of responses to stimuli that occur in the brain. EEG can recognize responses associated with feelings such as recognition, novelty, error, sleepiness, calm and focused attention. The invention here doesn’t stop with detecting these emotions but has the provision to add more sensors to detect data not available in the brain or to also incorporate data from other sensors on other devices that a user is also wearing. While an EEG can sense a negative response to stimuli it is quite difficult for the system to learn what generated this negative response. By providing the prediction based on EEG results the user now has a chance to reject the system’s prediction and correct it with their own experience. In this way, accuracy in predicting emotions can be improved. The patent was published on October 22nd, 2015 and for more details about the patent please visit the following websites: United States Patent & Trademark Office:http://patft.uspto.gov/netacgi/nph-Parser?Sect1=PTO2&Sect2=HITOFF&p=1&u=%2Fnetahtml%2FPTO%2Fsearch-bool.html&r=2&f=G&l=50&co1=AND&d=PTXT&s1=%22brain-state+data%22&s2=stephanie&OS=%22brain-state+data%22+AND+stephanie&RS=%22brain-state+data%22+AND+stephanie European Patent Office: https://worldwide.espacenet.com/publicationDetails/biblio?DB=EPODOC&II=0&ND=3&adjacent=true&locale=en_EP&FT=D&date=20151022&CC=US&NR=2015297109A1&KC=A1 World Intellectual Property Organization: https://patentscope.wipo.int/search/en/detail.jsf?docId=US152774732&_cid=P20-JYFQUM-28038-1  Small Bowel Obstruction Can be Fatal when Left Untreated Small bowel obstruction (SBO) calls for surgical emergency most common in the elderly population and its mortality (10%) and morbidity rates are also high. SBOs are generally the result of scar tissue, hernia or cancer. It is more common in developing countries accounting for 1-8 death per 1,00,000 population per year. SBO is the cause for 50% emergency laparotomies every year in the UK and over 3,00,000 admissions in the USA. In the US, most admissions for SBO are due to the effect of prior surgeries. Surgery for SBO primarily depends on the cause of the obstruction-some are treated without operation and others are operated for intestinal ischemia. While SBO in developed countries is due to intra-abdominal adhesions (in 75%b cases) followed by hernia, Crohn’s disease, malignancy and volvulus SBO in low- and middle-income countries is due to hernia (30-40%), adhesions (about 30%) and tuberculosis (10%) apart from Crohn’s disease, volvulus and parasitic infections. Bowel obstruction might be partial or complete where partial bowel obstruction allows some liquid and gas to pass through the point of obstruction but complete obstruction restricts any passage of bowel content.
Almost 10-12% patients above the age of 65 reporting abdominal pain at the emergency department are confirmed with small bowel obstruction and, emergency surgeries in elderly population is associated with high mortality and morbidity compared to elective operations. Those patients treated in a non-operate manner mostly have zero intake via mouth for days together while patients after surgery suffer from varying degrees of postoperative ileus. Such restrictions (going without food intake via mouth) can have debilitating effects on the patient who is already a high-risk candidate for malnutrition risk. Malnutrition is bad and even more profound in those with acute intestinal failure due to SBO. It would be helpful in assessing the prevalence rates of malnutrition and management options. Nutritional Balance in Patients with SBO The study included all UK hospitals undertaking emergency general surgery and adults over 18 suspected for SBO excluding those who were diagnosed with non-mechanical SBO, left colonic obstruction causing SBO or those managed with palliative intent for admission were not included in the analysis. Various details were noted such as period spent without consuming anything via mouth prior to admission in the hospital, body mass index, interval between last enteral intake and re-introduction of eating via mouth and nutritional supportive interventions were recorded. Nutritional Risk Index (NRI) was noted down using ideal body weight, current weight and admission albumin and patients were put into three different groups depending on NRI values-low risk (NRI >97.5), moderate risk (NRI 83.5-97.5) and severe risk (NRI<83.5). On execution of all conditions for inclusion in the study, a total of 2604 patients from 131 hospitals were included in the study. Here again patients were excluded based on few criteria (such as end-of-life care and not meeting study criteria) finally leaving the study with 2069 patients for analysis. Almost 30% patients were taken to surgery within 24 hours of admission, 22% were operated after being tried on non-operative procedures and 47.9% were treated in a non-operative fashion. All the patients had three things in common-all of them had a mean average age of 67, a small number of them were females and postoperative adhesions were the common cause of SBO. Results showed that 81.6% patients were assessed for malnutrition either by gauging with a screening tool or clinical judgement. 84.6% were assessed for malnutrition in comparison to 78.6% in the non-operative group. Among those whose NRI scores identified them as having moderate risk 36.4% got the help of a dietitian and the average time of review was 6.4 days. Those whose NRI scores showed severe risk had 55.9% of them reviewed by a dietitian and the average time for review was 4.5 days. Those in the low risk group had only 1 review every week with the dietitian. The nutritional interventions taken also depended on the NRI value. Among those in the low risk group only 30.3% patients received a nutritional intervention, 40.7% of them in moderate risk group got nutritional interventions and 62.7% in the severe risk group received the same. Higher and moderate NRI values indicated higher risk of malnutrition. Also, these were the ones who had severe or moderate risk of malnutrition at 4.2 and 2.4 times higher unadjusted risk of in-hospital mortality versus those in the low risk group. Severe and moderate risk patients were likelier to develop deliriums, infections and also had higher chances of re-operations. On a comparison, those patients in severe risk group who underwent a surgery were at a lower risk of hazard compared to those who were treated in a non-operative manner. The minimum time taken to initiate food intake orally was at least 1 week where operative treatment procedures usually took more time for oral feeding compared to non-operative ones. Almost one third of patients with acute SBO are at risk of malnutrition and this risk is associated with poorer outcomes. There are also chances that the patient is judged to be well-nourished while being admitted to the hospital but might later go on to develop malnutrition. The same happened in this study where 28% patients in the low-risk group were judged to have malnutrition and 12% ended up receiving parenteral nutrition. It is recommended to go for oral nutritional supplements when the patient is at risk of malnutrition and parenteral nutrition when there is no oral intake for more than 5 days. The risk here is that malnutrition might be detected at early stages of SBO but it is not readily correctable through conventional enteral interventions due to compromise of intestinal function. Gastrointestinal failure prevents nutritional improvement and absorption which prevents adequate calorie intake. This shows that SBO is highly prevalent in the SBO patients, even diagnosis rates are higher but preventive methods and nutritive programs are not much in place to treat it. References Malnutrition, nutritional interventions and clinical outcomes of patients with acute small bowel obstruction: https://bmjopen.bmj.com/content/9/7/e029235  Frozen & Chilled Seafood Contains Aplenty Nutrients in its Kitty  Water used for Processing Fish is a Nutrition Treasure that Can be Used for Many Other Purposes Water used for Processing Fish is a Nutrition Treasure that Can be Used for Many Other Purposes Weekends are probably spent cooking up yummy dishes and non-veg items are a mandatory inclusion during weekends in most of our homes which on other days run on pre-packaged meals, take-away foods or ready-to-eat items. Such a lifestyle promotes increased sugar and fat intake paving way for increase in obesity and diabetes rates. Apart from time and preference, availability and knowledge of nutrition and health too impact our choices. Adapting ourselves to healthy and nutritious foods and redesigning our meal menus is a definite way to tackle the lifestyle problem and pave way for better eating habits. Apart from eating aplenty of fruits, veggies and whole grains we do need a share of certain other nutrients as well to reshape our health and seafood is presently considered as an essential food due to the presence of high-quality proteins, n-3 polyunsaturated fatty acids (PUFAs), minerals, vitamins (vitamin D, B12), iodine, selenium and trace elements-all of which help in promoting brain health and growth. The presence of PUFAs such as eicosapentaenoic acid (EPA) and docosahexaenoic acid (DHA) that are predominantly present in fish oil make way for a healthier body and are often sold as functional foods (those that provide basic nutritional functions and reduce risk of lifestyle-related diseases). Seafoods also improve imbalanced dietary habits and prevent lifestyle-related diseases, all at an economical rate helping to prevent a food crisis in many developing countries.
Fish is an abundant source of protein, increases the bioavailability of minerals like zinc and iron and it is no surprise that production has almost doubled in the past couple of decades. There are numerous studies showing that seafood is an excellent source of nutrients, prevents the occurrence of diseases such as CVD and diabetes, helps in child cognitive and visual development and many more too. But sadly, their advantages were not celebrated until about a few decades ago! Gone are the days when our ancestors used to fry fish fresh out of the sea or use vegetables soon after plucking them from the garden. These days, every food undergoes some kind of processing and the degree of processing depends on the product consumed. There are many processed seafood products such as fish cakes, fish pudding, fish au gratin and so on available in the market and it now becomes a necessity to understand the nutrient composition of these products. Norway is a country which shows widespread use of such processed fish products and the study for nutrient composition of seafood that’s elaborated below was conducted in this country. Norwegian Study on Processed Seafood Products Different processed seafood products were selected and 1-7 products from each product type (such as fish cakes) was chosen. All the products were purchased from grocery stores either in chilled or frozen condition between 2015 and 2018. All the products were analyzed as composite samples consisting of three different batches and were homogenized into one composite sample. When there were multiple units in one package only three of them were included from each batch. Each of the composite samples was analyzed for total protein, fat, saturated fatty acids (SFA), monounsaturated fatty acids (MUFA), polyunsaturated fatty acids (PUFA), sum n-3, sum n-6, EPA and DHA. Nutrients including selenium, iron, calcium, zinc, sodium, vitamin A1, vitamin B12 and vitamin D3 were analyzed in 2015 while in 2017 only vitamin D3, iodine, selenium, calcium, iron, zinc, calcium and sodium were analyzed along with fats and fatty acids and in 2018 it was only vitamin D3, iodine, selenium, calcium and sodium besides fatty acids. All samples were freeze-dried, homogenized and pulverized before analyzing: fat was extracted with ethyl acetate, protein was measured by burning material in pure oxygen in a combustion tube, nitrogen was detected with a thermal conductivity detector (TCD), protein content was calculated using a formula (N g/100 g*6.25=protein g/100 g), fat composition was determined by gas chromatography (GC) fatty acids was identified by retention time using standard mixtures of methyl esters, vitamin A was calculated using ultra-performance liquid chromatography (UPLC), retinol content was calculated by external calibration, vitamin D3/D2 was calculated using internal standard, vitamin B12 was released from the sample by extraction, mixed with growth medium and added to the microorganism and its content measured by comparing growth of organism in unknown sample with growth of organism in the known samples, concentration of selenium, zinc and iron was determined by Inductively Coupled Plasma-Mass Spectrometry after wet digestion in a microwave oven and the concentration of calcium and sodium was determined using an external calibration. The research team selected one product of fatty fish, mackerel in tomato sauce and two products of lean fish and fish cakes/burgers to analyze how much each product contributes to total recommended intake (RI) using the Nordic Nutrition Recommendations (NNR): Daily RI values for adults include 250 mg for EPA+DHA, 10 μg for vitamin D, 2.0μg for vitamin B12, 800 μg for vitamin A, 150 μg for iodine, 55 μg for selenium, 8 μg for zinc and 800 μg for calcium. Also, one portions size was equivalent to 40 g of mackerel in tomato sauce, 150 g fish cakes and 275 g fish au gratin. Results showed that:
Seafood-processed Water Enriched with Nutrients Seafood processing required ample water (for boiling shrimps/mussels or filleting/salting/marinating herring) which are then treated as waste once the processing action is complete. But its now shown with evidence that this water contains valuable nutrients that could be used in food or even aquaculture feeds. Its been observed that we need 7000-8000 liters of water for preparing one ton of marinated herring while another 50,000 liters of water is needed to prepare one ton of peeled shrimps or for every three tons of raw shrimps. What we have been missing until now is the fact that the water used for boiling shrimp is readymade stock and the water used for marinating herring contains proteins, peptides, fats and micronutrients that could be used as an ingredient in feed or for growing microalgae. The study from Sweden shows that there are quite a few irresistible nutrients found in these processed waters that are indispensable for health. For example, they contain 7% protein and 2.5% fat. The process water from shrimp contains astaxanthin, a red-colored pigment, and an antioxidant that is used as a dietary supplement. Herring processing until now showed that 15% of herring protein was treated as waste but using a two-step approach the research group was able to recover up to 98% protein and 99% omega 3-rich fats. This process paved the way for a semi-solid biomass and a nutrient-rich liquid. After dehydration, the biomass from shrimp boiling water contained 66% protein and 25% fat. This biomass was used as an ingredient in feed for salmon. Something similar to this has already been implemented in the dairy industry where the residue from preparing cheese, whey, is considered a treasure in sports nutrition as well as in other areas too. References New data on nutrient composition in large selection of commercially available seafood products and its impact on micronutrient intake: https://foodandnutritionresearch.net/index.php/fnr/article/view/3573/9309 Recovering nutrition from seafood process waste: https://foodandnutritionresearch.net/index.php/fnr/article/view/3573/9309  Is Responsible Drinking a Myth in Reality? Right before the screening of a movie we are shown two statements 1. Smoking causes cancer, smoking kills and 2. Consumption of alcohol is injurious to health. Right after this, we get commercials for different products and alcohol indeed could be one of them in the name of club soda or energy drink. Direct marketing of the product is avoided but we do have celebrities who preach non-violence and condemn alcohol in movies holding an alcoholic beverage in hand posing for the commercial. Right after smoking and hypertension alcohol use is the third highest cause of diseases in the world and causes more than 3 million deaths annually. Ad campaigns for alcoholic beverages are many and such exposure to different ads kindles the curiosity of consumers and encourages them to get a taste of the beverage. At the same time, targeting marketing, availability and pricing of alcohol are the effective options available and the alcohol industry does take actions in the form of providing information and education- sending out messages such as ‘Drink Responsibly’ in the form of campaigns that started during the 1970s as a part of corporate social responsibility. These statements are parts of industry norms in the name of corporate social responsibility (CSR) but what exactly is the alcohol industry trying to achieve?
Alcohol consumption can pave way for diseases such as liver cirrhosis, cancer, suicide, violence and cardiovascular disease apart from affecting quality of life by ruining income, forcing unemployment, creating family stigma and involving health care barriers. For all the ads and hoardings displayed by the breweries counteractions are taken by governments in the form of public health campaigns (such as short films shown before your movie at the theatre or audio messages released by higher government authorities in radio) and statements. But of late, alcohol producer organizations too come forward with 100% support for improving health and social outcomes for individuals and family members in the form of reducing drink and drive cases, providing more product information and minimizing age-inappropriate drinking. Many of the global alcohol manufacturing companies are part of the International Alliance for Responsible Drinking (IARD) where the target is to reduce harmful use of alcohol by at least 10% by 2025. In UK almost 3/4th of alcohol product labels contain statements such as ‘Please drink responsibly’; the Australian government has imposed beverage restrictions that includes drinking no more than two standard drinks in a day to reduce lifetime risk or no more than 4 in a single session to reduce short-term risks. At the same time, extensive ads are being launched with the availability of social media sites at our disposal. Research on public health campaigns shows that these helped reduce the urge to drink compared to those ads that promote alcoholic beverages. But there are also research studies suggesting that limited effectiveness of such ‘drink responsibly’ statements might be due to the way these are designed and promoted (they rarely focus on the harms or give solutions to attend to behavioral changes). This makes us revisit CSR of these companies and how the public view them. CSR in the UK A comparative study analyzed how ‘responsible drinking’ is defined and used by the alcohol industry. All published contents were fetched that included any variations of the term ‘responsible drinking’ and these were compared to a sample of press releases and website information from World Health Organization (WHO) and other public sector companies. 101 documents referred to ‘responsible drinking’ and were included in the analysis. There were 2 multinational alcohol producers (Diageo and AB InBev), Diageo’s DrinkIQ website, the Portman Group, the International Alliance for Responsible Drinking (IARD), the International Centre for Alcohol Policy (ICAP) and the DrinkAware Trust. Results showed that:
Another systemic review that complied with the Preferred Reporting Items for Systematic Reviews & Meta-analysis (PRISMA) guidelines included 21 studies that met the inclusion criteria and there were five types of CSR initiative taken by the alcohol industry which includes alcohol information and education provision, drink driving prevention, research involvement, policy involvement and creation of social aspects organization. There was little evidence found supporting that fact that a company’s CSR benefit’s public health. A study by Esser et al analysed 266 CSR activities conduced by alcohol industries. While the alcohol industry reported an evaluation of their cases in more than 1/3rd of cases it was only 3% of these cases that measured outcomes to establish effectiveness in reducing drink driving and more than 2/3rd of the actions examined in the study were flagged as having the potential for harm. A number of studies proved that the CSR effort instead of having a positive effect could in fact have a negative impact on the people. The alcohol industry cites ‘culture’ as a contributor to alcohol issues but does not involve any discussions on how the industry has influenced in shaping the drinking culture. All these companies advertise and post messages about drinking responsibly and moderately only because they are bond by the rules and regulations of CSR. Their job ends there and all that they have left with them are to find tactical ways to improve sales percentage and succeed in their business venture. References What does the Alcohol Industry Mean by Responsible Drinking: https://academic.oup.com/jpubhealth/article/40/1/90/3111234 Alcohol Industry Corporate Social Responsibility Initiatives and Harmful Drinking: A Systematic Review: https://academic.oup.com/eurpub/article/28/4/664/4985717  Iron Deficiency Can Obstruct Proper Immunity to the Body  Fish & Meat are Excellent Heme Sources of Iron Fish & Meat are Excellent Heme Sources of Iron Iron is an indispensable nutrient required by every human for oxygen transport, energy production and neurotransmitter synthesis. Despite its criticality, iron deficiency (ID) remains the topmost nutritional deficiency worldwide having affected more than 30% of the world population. The statistics sound alarming but there is truth to it-there are one or two cases of those irrespective of their age (even as young as 10-year-olds to as old as 70-year-olds) suffering from anemia in each of our homes (especially girls). ID and ID anemia (IDA) are a problem present in both developing and developed countries which have an impact on pregnancy outcomes, mortality rates, immunity levels, cognitive functions and physical development in kids. Almost 40% of perinatal maternal deaths are due to anemia, performance of school-going kids becomes greatly hampered due to their cognitive decline experienced due to ID and thyroid functions too are affected. Even in those who suffer from ID alone there is a risk of reduced physical activity, diminished productivity and increased fatigue.
Anemia is also a condition that’s commonly present among the elderly population whose rates keep increasing with increasing age. We are quite aware that the elderly population are becoming more in number, especially in the developed countries where access to medical facilities and all other provisions are easily available. Japan, a country which is known for a longer lifespan is expected to quadruple its elderly population by 2050 and what would be the effect of anemia on them? US reports higher number of anemia cases among elders residing in nursing homes in comparison to those living in the community. Australia too shows that it’s their elderly population who are the greatest victims to anemia-a condition that rapidly increases in proportion after the age of 65. Iron Deficiency ID is the result of insufficient absorption or intake of iron to meet the body’s iron requirements. There are several factors affecting the absorption of iron which include the individual’s iron status, iron content and composition of the meal. Dietary iron is of two types namely heme and non-heme. Animals foods such as fish, beef, pork, lamb and poultry are common sources of heme iron whose absorption rate is comparatively higher to the non-heme form whose sources are plant-based foods such as vegetables and grains. So, the diet that you consume plays a critical part in affecting your iron levels in the body. In Australia, there is a recommendation for adults to consume a maximum of 65 g of lean meat/day from nutritive food sources. Though occurrence of anemia is common with ageing it is not a natural effect of ageing but might be the result of an underlying chronic condition or nutritional deficiency of iron, folate and vitamin B12 (1/3rd of anemia cases in elderly people are due to iron deficiency). Fish and meat are reliable sources of vitamin B12 and iron but the consumption of these foods differ from country to country. For example, the elderly population of Japan consume more fish but less meat and the consumption of these animal sources differ between Asian and Western population too-fish consumption is higher in Japan than in the United States. Meat contributes to about 14% of the daily total iron intake in the United Kingdom. But there are lack of studies linking fish intake with anemia risk. The study below assesses the link between intake of animal foods and the risk of anemia in the Japanese population. Japanese Long-term Study A total of 6,469 participants were involved in the study after they were chosen based on different criteria such as abstinence from using iron supplements or fulfilled the age criteria of ≥65 years. Smoking habits were noted down and each of the participants were segregated into one of the 3 groups-past smokers, current smokers and no smokers-based on certain criteria. Exercise habits were taken down and every volunteer belonged to any of these groups-unable to exercise because of illness, unable to exercise because of other reasons and exercising regularly. BMI values were noted and dietary intakes were monitored. 9 nutrients ((carbohydrate/ total fat/ total protein/ animal protein/ plant protein/ iron/ vitamin B-12/ folate/ vitamin C), 7 food groups, 13 food items for fish ((mackerel, sardine/ salmon, trout/ sea bream, flatfish/ tuna, marlin, swordfish/ other raw fish/ shellfish/ squid, octopus/ prawn, shrimp, crab/ salted, semidried, fully dried seafood products/ canned fish products/ tsukudani/ fish paste products/ fish ham and sausage) and 9 food items for meat ((beef/ pork/ ham, sausage/ other animal meat/ chicken/ poultry/ organ meat/ whale meat/ insects, frogs, and turtles) were used in the present study and the daily intake of fish and meat was calculated as the sum of the 13 and 9 food items. Blood samples were collected and anemia was defined as hemoglobin concentrations <13.0 g/dL in males and <12.0 g/dL in females (according to WHO). Results showed that:
Iron Consumption & Anemia Prevention: A Systemic Review We do recommend dietary modifications to include greater sources of iron (animal foods) and this does seem to be a simple solution but the effect of this on the individual is not extremely clear. The question does arise whether higher consumption of animal flesh paved way for better iron levels in adults in developed countries. The systematic review included studies based on different criteria, animal flesh was defined as the muscle tissue of an animal carcass (such as red and white meat from chicken/poultry, sheep, pig, cattle, goat, fish, buffalo, kangaroo, camel and deer). Processed meats such as ham, bacon and sausages were also included. 49 studies were included in the review which consisted of 111,846 participants totally. Only 9.6% of the total participants were males, 2 studies were male-only, 29 studies were female-only and the remaining 18 studies consisted of mixed participants. Age of the participants were between 18 and 93 years. Results showed that: Seven studies showed positive results of which six of them focused on women of childbearing age and they showed that intake of iron had a positive impact on these individuals. One study, Blanton found that moderate consumption of beef resulted in significantly higher serum ferratin (SF) Hb concentration at 16 weeks, the number of women who experienced a SF response during the intervention was not different between beef and non-beef lunch groups. Iron status of women is closely associated to the baseline iron level and women with a lower baseline experience greater improvement due to addition of iron-rich foods. Two studies showed that women who diet for weight loss are at an increased risk of developing poor iron status. So, those women who include meat as a regular part of their weight loss diet have a protective effect on iron status. Exercise too depleted iron stores as sweat and including foods rich in iron help exercising women of childbearing age. Observational studies show conflicting results. Two studies showed that women consuming greater quantities of red meat and animal flesh had better iron status and reduced risk of iron deficiency but another study, Pynaert et al. showed that there was no link between the two. Few large observational studies included pre- and post-menopausal women who showed benefits reaped due to total flesh intake and iron status. In a large cohort study done on postmenopausal female population increased red meat consumption was reported in women without ID anemia indicating that red meat might be beneficial to lower the risk of ID. A majority of the observational studies reported greater SF and iron status indices in subjects consuming an omnivorous diet compared to a vegetarian diet showing that including foods such as fish and meat does increase greater iron status for adults. Beck et al found that those individuals consuming the highest amount of meat and vegetables had greater SF and Hb and reduced ID risk in comparison to those consuming least meat and vegetables. Totally, only seven studies showed beneficial effects of consuming animal flesh and iron levels, 38 rated neutral effects and four of them marked negative effects. But overall, there seems to be an optimistic link between consumption of animal flesh and iron status of adults within developed countries. Meat is an important source of a variety of micronutrients and red meat is a great source of iron (almost 50-60% is in the easily absorbed heme form). Iron is present in the protein heme structure which makes it readily available and in higher amounts (15-25%) in comparison to the plant source (1-7%). Whereas, plants have chelators such as phytic acid that reduce iron absorption. But we do have studies showing that overconsumption of iron-rich foods or too much of iron content in the body is also not good for health. Animal foods are the go-to foods if you would like to add iron content to your body in a minimal time. Ensure to eat a well-balanced diet consisting of a portion of fish and meat alongside your fruits and vegetables as well. References Fish & Meat Intake & Prevalence of Anemia among the Japanese Elderly: http://apjcn.nhri.org.tw/server/APJCN/28/2/276.pdf Is Higher Consumption of Animal Flesh Associated with Better Iron Status Among Adults in Developed Countries? https://www.ncbi.nlm.nih.gov/pmc/articles/PMC4772052/ The Impact of Lean Red Meat Consumption on Human Health: https://www.tandfonline.com/doi/full/10.1080/19476330902940523  Your Love & Affection has the Power to Neutralize Pain  The Five Phases of 'Awareness of Dying' The Five Phases of 'Awareness of Dying' It’s rare to see someone satisfied with his/her life irrespective of the power, money and status they possess which are rarely reasons to stay happy/unhappy at the end of day. I believe that its purely our mindset that affects our mental well-being and happiness quotient. If you doubt whether happiness and peace of mind have any roles in affecting your health even the World Health Organization recognizes it as a part of the concept of health and says that it has an indispensable role in affecting your quality of life. This fact holds good in the case of common man but what about its role in people living with advanced cancer? We need to mention about palliative care at this point as this is the treatment used to relieve pain and improve quality of life of patients in their advanced stages of cancer where there is no hope for cure. This exists as one of the topmost needs of people living worldwide with cancer, especially in those with advanced stages of cancer where cure is highly improbable and relief from physical, psychosocial and spiritual problems is achieved almost 90% of the time with palliative care. Cancer is the second leading cause of death worldwide and was responsible for more than 9.6 million deaths in 2018. Almost 1 in 6 deaths is due to cancer, there are more than 14 million new cases diagnosed annually and more than 32 million people living with the disease. Of these 32 million there are some of them undergoing treatments in the form of chemo and radiation to kill the cancer cells and few who are in the advanced stages where complete recovery is not possible. The probability of treatment in these patients is close to nil but even these people live longer and these days, want to live well despite their nearing death which calls for more and more research and probing into this field of study. Frame of Mind of People with Advance Stage Cancer Old age always keeps a person in constant fear of death as the individual expects it at any time in life. Likewise, an advanced-stage cancer patient too fears death anytime and this causes psychological impact on the person. Those with advanced cancer are burdened with multiple issues such as side effects from prolonged treatments, complicacies of the health system and the burden of living with a certain guarantee period for life. These sometimes changes the person’s entire perspective on life and death. Almost 15-19% patients in palliative and cancer care experience depression, 10% experience anxiety and 38% experience mood disorders. Physicians are obliged to provide psychological support to all of their patients but its been noticed that physicians mostly focus on physical health in comparison to psychological health. Advanced cancer patients suffer greatly from psychological issues but the problem is that there are not many interventions and methods addressing these issues and providing effective solution to patients. Researchers are now more into understanding the thought process of people with advanced cancer and there is in-depth study conducted regarding the outlook these people have towards dying. One recent metasynthesis found that people with advanced cancer wished to lead a normal life despite their nearing death and physical suffering too trying to find a new meaning in life. Such people include various strategies such as avoidance, try to be normal, focus on the positive aspects in life, minimize the disease’s impact and try to predict the output of their present treatment. While we do know that people survive through advancer cancer living a life well-lived the process and manner in which they do it are not quite clear. A research focused on 43 participants who were dealing well with the complications of different chronic illnesses in such a superb way that the researchers were surprised and happy for them. A theory (Theory of Living Well with Chronic Disease) based on the research was framed and this theory shows that there is an iterative ‘healing Process of Moving On’ through which people revisit five interconnected phases (The fight, Accepting, Living with the Chronic illness, Sharing the Experience and Reconstructing Life). The individuals keep rotating between these phases depending on their illness condition and frame of mind. Two authors were involved in the secondary study, the first one was familiar with the theory which led to a question whether the theory could be applied to different cultures as well. This present study is a secondary analysis of quality data collected in a phenomenological study that was conducted to gain a deep understanding of the thought process in people with advanced cancer. The current study mainly focuses on the process of living and has a 2-fold aim – to explain the process of living and support patients when time is uncertain and limited, and to check whether the theory formulated in the previous study could be applied to a more specific scenario of advanced cancer. Original data was collected by interviewing 22 Spanish participants of which 12 of them were men and 10 were women who were from 45 to 83 years of age. The time interval between the interview and participant’s death varied from 22 days to 2 years. The patients were asked questions such as ‘Would you describe your life with this disease?’ Two researchers were involved and both of them listened to the audio recording of the answer, coded one transcript at a time and discussed about it before moving to the next. Two main questions evolved while coding-What is it about? What is going on here (in relation to living with advanced cancer)? The second step involved comparing the codes with the Theory based on questions such as ‘Does this code fit the Theory?’, ‘If so, how?’ and ‘If not, what is going on that is different?’ While in the Theory the first phase was called ‘The Fight’ in the secondary analysis participants experienced more of ‘Struggling’. The second analysis showed that participants with advanced cancer lived around the concept of ‘Awareness of Dying’ with five phases that included Struggling, Accepting, Living with Advanced Cancer, Sharing the Illness Experience and Reconstructing Life. Struggling: There were responses of shock, anger, anxiety and fear in participants when they realized that they would die anytime soon. The duration and intensity varied and in due course they learnt to let go of the struggle and move forward in life as the struggle was creating more problems alongside the emotional disturbance. Accepting: This phase is where the participants started accepting the presence of advanced cancer in life as it helped them attain peacefulness in life. Living with Advanced Cancer: Four strategies help in living with advanced cancer when the patient’s time limit in life is short-making life adjustments, maintaining a positive attitude, normalizing and hoping. Normalizing is quite difficult as not everyone can lead a normal life-some of them are hospitalized for months together while some get to lead their normal daily routine life. For those who cannot experience normalization hoping was the one they sought solace from-hoping to get out of the hospital and resuming their normal life. Sharing the Illness Experience: Many patients feel good to have someone to share their feelings with, someone to stay with them daily every day and night and having someone to count on to share their experience. At the same time the patients were worried that their sufferings were also shared by their dear ones. Reconstructing Life: Here, patients were focused more on living thereby pushing advanced cancer into the background. Focus was given more to shifting one’s perspective away from illness and living in the moment-a way to maximize precious time in life. This study clearly shows that accepting is the best way to move forward in people with advanced cancer. Staying positive, making best use of the time provided and cherishing the care and affection of family members are golden ideas that can be practiced by patients with advanced cancer. Coping Strategies In another study 26 participants suffering from advanced breast, prostate, lung and colorectal cancer discussed about four different coping strategies that they practiced in their life: everyday pragmatism, self-awareness, relying on others and communicating. Everyday pragmatism: There are three sub-strategies involved in this including being realistic, changing priorities and focus on the everyday. Participants felt that being realistic was much needed for maintaining wellbeing as it helped in decreasing depression and anxiety. It also helped the volunteers accept the presence of the disease and the reduced life expectancy in course of time. Self-awareness: Volunteers planned activities, outings or ‘good days’ and created a self-awareness of coping with various strategies. The patients also made conscious efforts to like few foods as they were good for their health, acknowledged the advantages of getting enough rest and fight off fatigue. They also experienced well-being by indulging themselves in small treats, rewards and certain activities that helped them switch off the diagnosis and prognosis such as shopping or visiting loved ones. But this isn’t possible on all days as many are spent in resting owing to symptoms such as nausea or vomiting or general fatigue. Relying on Others: Participants spoke about relying on others for emotional and social support but some of them expressed that to accept the need for support was challenging. Though they didn’t always ask for support the participants took enough time to express their gratitude to people who offered their support in times of need. Communication: This was a coping strategy by itself and also helped improve the effectiveness of other strategies. While some people felt it comforting to communicate with complete openness this level of disclosure did not suit certain other participants.  Physicians are Obliged to Ensure Mental & Physical Well-being of Advanced-stage Cancer Patients Physicians are Obliged to Ensure Mental & Physical Well-being of Advanced-stage Cancer Patients This study too shows that people with advanced cancer develop coping strategies that uplift their well-being. The patients also wish to develop such strategies at an early stage of their disease trajectory by discussing with their peers and healthcare professionals. Physicians too are obliged to identify people with advanced cancer who might benefit from access to such information about coping strategies. Hence, these physicians also cater to the person’s psychological well-being besides caring to their physical wellness. Palliative care is becoming more and more important and is a central aspect to cancer care. We cannot extend the life tenure of patients with advanced cancer but surely can contribute towards their well-being, hope, happiness, trust and peace by taking care of their mental and physical health. References People with Advanced Cancer: The Process of Living Well with Awareness of Dying: https://journals.sagepub.com/doi/full/10.1177/1049732318816298 Coping Well with Advanced Cancer: https://www.ncbi.nlm.nih.gov/pmc/articles/PMC5249149/ Clostridium difficile (C. diff) is a bacterium that’s not new to us as it has been present forever in our environment. Many of us are even happy bearers of this pathogen without facing any troubles. Its not that every individual with C. diff is a patient as it is not the bacteria that’s harmful but the release of toxins by it under certain circumstances that makes someone sick. One of the common circumstances under which toxins are released include consumption of antibiotics which exists as the major risk factor for Clostridium difficile infection (CDI) due to C. diff. It was not until 1978 that CID was tagged as a major cause of diarrhea and colitis after which there was a steady increase in the rate of incidence, morbidity and mortality. Though common in the elderly population CDI spares none and mostly affects those taking antibiotics for various other medical conditions. This is one of the reasons why physician don’t encourage the use of antibiotics for all your health-related problems unless and until their use becomes indispensable. Surprisingly, for a disease whose main risk factor is antibiotics the first-line treatment for it is also antibiotics. Though CDI might be treated with a course of antibiotics there are greater chances of recurrence of the disease in more than 20% of the patients treated within 30 days of antibiotic treatment which remains a greater challenge while treating CDI. Worse, the recurrence risk doubles when CDI occurrence rates exceed 2-3 times and exceed 90% chances when the individual is above 65 years of age, suffers from severe disease and continues using antibiotics even after treating CDI. Also, inflammatory bowel disease (IBD) one of the greater risk factors for CDI infection increases recurrence rates and also the severity of colitis.
Our gut microbiota plays an important role in tuning our health. It contains millions of pathogens-bacteria and viruses-that help in the functioning of our body and protecting us against diseases including CDI. So, while a normal gut microbiota protects against CDI use of antibiotics (such as vancomycin and metronidazole) to treat CDI becomes the root cause for the recurrence of the infection in due course. Antibiotics, a number of them, have been used to not only suppress C. diff but also to preserve the residual colon microbiota. But, as antibiotics are also responsible for a major portion of recurrence of the infection physicians are now challenged with a mission to find a definite solution. Fecal microbiota transplantation (FMT) is not something new but the only thing is that its gained popularity in the last couple of years. FMT is a method wherein stool from a healthy donor is placed into the gut of a patient as a treatment method for certain diseases. It helps to build back lost colon microbiota stores but has been considered as the last resort for treating patients with CDI owing to a number of reasons- absence of enough donors when required, difficulty in preparing and administering materials, how good the procedure would be to the patient’s eyes, how willing the staff would be to perform the procedure and issues with sanitation. Also, pharma industries haven’t shown much interest in taking FMT to the next level as donor material is widely available, its composition is highly complex and people willing to involve themselves in research are few. Rather, advancements have been made by individuals who care about their patient’s well-being. The invention patented here is an extract or a preparation of human feces. Until this invention, the donor was mostly a close family member as this individual material was assumed to be better tolerated by the recipient’s immune system owing to prior exposure. But there are a number of disadvantages that go with it which includes even accepting material from donors with suboptimal health. But the invention here builds a fecal composition that goes through intense donor screening, multiple filtration steps that remove non-living material and freezes the composition to preserve its viability. Above all, the composition is almost odorless, in concentrated form and makes useful composition of colon microflora readily available for physicians to treat their patients. The composition invented here comprises of fecal microbes that are present in the gut, intestine and colon of healthy individuals obtained by processing fecal material (human stool). Before processing, the stool comprises of non-living material (this includes undigested fiber, dead bacteria, proteins, fats, carbohydrates, mucus, bile and other foods) and biological material. Biological material includes bacteria, archaea, fungi and viruses. The composition might be given to the patient in any of the suitable methods that would inject the good protozoans into the gastrointestinal tract. Methods used could be rectal administration (enema, upper endoscopy or colonoscopy), intubation through the nose or the mouth (nasoenteric tube or nasogastric tube) and oral administration (pill or capsule). While the concept of fecal transfer seems disgusting the procedure is lifesaving and has tremendous potential in becoming one of the most sought-after medical procedures in history. The patent was published on 13th September 2012 and for more details on the patent please visit: United States Patent & Trademark Office: http://patft.uspto.gov/netacgi/nph-Parser?Sect1=PTO2&Sect2=HITOFF&p=1&u=%2Fnetahtml%2FPTO%2Fsearch-bool.html&r=6&f=G&l=50&co1=AND&d=PTXT&s1=transplantation&s2=%22colon+microbiota%22&OS=transplantation+AND+%22colon+microbiota%22&RS=transplantation+AND+%22colon+microbiota%22 European Patent Office: https://worldwide.espacenet.com/publicationDetails/biblio?DB=EPODOC&II=0&ND=3&adjacent=true&locale=en_EP&FT=D&date=20180430&CC=PL&NR=2683390T3&KC=T3 World Intellectual Property Organization: https://patentscope.wipo.int/search/en/detail.jsf?docId=WO2012122478&_cid=P21-JXZV0M-84871-1  Effects of Chewing Gum are Inconclusive Until Now As children, many of us never had the habit of chewing our food and then swallowing it. Though the advent of kids’ channels and YouTube subscriptions is only recent, we did have our share of Shakthimaan, Little Krishna, Tom & Jerry and our sweet little games played with close friends to quickly get over the ritual of eating food. Mom used to feed the rice/roti into our mouth and even before she could pick up another handful our mouths would be wide open just because we never chewed our food but only swallowed it. Growing up, we decided to take better care of our health and started chewing the food but once again with competitive education, job pressure and lack of time, as adults too our intention to chew has disappeared into thin air. We almost gobble up the food during breakfast (if in case we eat it!) or munch on a burger during lunch in such a hurry that we don’t even remember whether we chewed or swallowed!
Chewing is the very first step in eating. It enables the food to break down into smaller particles, mix with saliva and finally swallow it down the food pipe. While crushing food to aid in easy digestion was assumed to be the core function of chewing, we now have studies showing that chewing in fact is associated with brain functions too! While we might be surprised by this, the link between chewing and cognitive functions was established long ago, as early as the 1930s when it was discovered that chewing helped reduce stress and also improve cognitive performance. Since then there have been studies trying to relate chewing to attention, memory retention and other cognition-related functions but results have been inconclusive. Hypothesizing that chewing does improve attention different studies were reviewed and their results analyzed. Studies that reported effects of chewing in healthy adults and children but not in elderly population and those that probed into the efficiency of attention, alertness, vigilance and executive control compared with no gum chewing conditions were considered. 22 articles were eligible and the following variables were noted for each of them:
Cognition is inversely proportional to age. As we grow old, psychological, neurobiological and social factors impact our ability to think and keep information and dementia rates also prevail in higher numbers. Mastication and the number of teeth in an individual too seem to affect cognitive functions. The number of teeth decrease in elderly population and this leads to oral health problems which in turn affects the general health of the person. The ability to chew properly remains utmost important in people to safeguard their general health, oral health and cognitive abilities. Hippocampus is the part of the brain that helps in forming and retrieving memories. Improper/impaired mastication causes functional alterations of the hippocampus while proper mastication helps in promoting hippocampus function. Let’s understand how mastication and the hippocampus are related to each other. Mastication is the first step in digestion where the tongue, facial and jaw muscles act in coordination to crush the food and prepare it for swallowing. The bones (maxilla and mandible), muscles, teeth and soft tissues (tongue, lips and cheek) are involved in mastication. We have animal studies showing that blood oxygen levels in the prefrontal cortex and hippocampus are increased by mastication and decrease in mastication either due to extraction or reduction in molars can inhibit memory and learning. We do have several human studies showing that chewing is effective for preserving hippocampus function that gradually deteriorates with ageing. Even sucking a small piece of a sugar-free gum was linked to better cognitive performance. Chewing increases the flow of blood to the muscles and decreases risks of cognitive decline. Mastication during stressful situations attenuates stress-induced impairments of plasticity in the hippocampus. Gum Chewing & Cognition We do have studies both supporting and denying the advantageous effects of gum chewing on cognitive abilities. 26 studies were filtered and their results were thoroughly analyzed. Effects of Gum Chewing on Cognition Immediate & Delayed Memory: Immediate recall refers to retrieval of information immediately after learning while delayed recall refers to retrieval of information after a prolonged period (several minutes to days or even longer) of learning. In a study by Wilkinson et al, it was found that chewing a piece of sugar-free gum improved both immediate and delayed (in less than an hour) recall of previously learned words (15 words). Baker et al tried to replicate this research on 15 words but their results showed that they did not find any effect in immediate recall but chewing gum posed beneficial effects on delayed recall even after a delay of 24 hours. Tucha and colleagues performed two tests-one for attention span and another for delayed and immediate recall but results failed to show anything positive for immediate or delayed recall. Miles and Johnson too conducted the same studies and in fact found detrimental effects of gum chewing on immediate and delayed recall. Kozlov and et performed well-controlled studies to show the impaired effect of chewing gums on immediate recall. The authors could confirm the detrimental effect of gums and also could confirm that the results remained the same regardless of the mode of assessment (word, letters or numbers). While totally 16 studies examined the effect of chewing gum on immediate and delayed recall, 2 studies found beneficial results, 6 showed positive effects on delayed recall, 1 showed detrimental effect on immediate and delayed recall, 2 showed negative effects on immediate recall, 2 failed to find any effect on both, 4 found no positive/negative effect on immediate recall and four others failed to find any effect on delayed recall. Context-dependent Effects of Gum Chewing on Memory ‘Context’ refers to the impact the environment or internal state of an individual has on information acquisition and retrieval. It was generally seen that recall of information was better when the context during recall was similar to the context that existed during learning. Baker and et found that a change of context during learning and retrieval produced adverse effects on recall. While Johnson and Miles could not produce any results on context-dependent benefits on delayed recall and in another study even proved that those who did not chew gum during both learning and recall performed better in comparison to those who chewed gum. Two studies found that chewing gum could provoke context-dependent effects on long-term memory while four studies could not find any link. So, context-dependent effect shows that it was not that chewing the gum gave better results. Maintaining the same context while learning and retrieving (chewing the gum or not) enabled better outcomes than those participants performing in inconsistent context conditions. Attention Attention is critical for cognitive and emotional functioning. One study showed that gum chewing was negatively associated with alertness and two studies found that chewing was in no way associated with linked to gum chewing. Though it was seen that alertness levels increased when gum was chewed prior to testing. Gum chewing though had a positive impact on sustained attention. Taenzer and et found that kids aged 8-9 years performed badly on a sustained attention task than children who did not chew gums. While this result was observed during the first 12 minutes of the test, during the last four minutes children in the no-gum category were outperformed by those in the gum-condition showing that gum chewing did have a beneficial effect on sustained attention. Stephens and Tunney witnessed improved results in selective attention when participants chewed gums. Shifting of attention was actually impaired due to gum chewing in one study but another study saw no differences in results. Totally, 12 studies focused on gum chewing: 4 of them found that gum chewing improved sustained/selective attention, 4 showed detrimental effects of gum chewing on selective attention, alertness and shifting and sustained attention, five of them failed to prove that gum chewing affected alertness, sustained attention, selective attention or divided attention. Intellectual functioning, executive functions and spatial skills too showed contradictory effects when studies were conducted as some supported gum chewing while others condemned gum chewing based on their study results. One thing is clear, gum chewing does affect cognition but what has to be confirmed is whether it does have 100% positive effects or detrimental effects on the person chewing it. Worldwide, the number of people chewing gums are high-in a survey of American undergraduates almost 87% reported chewing gums at least occasionally, 61% respondents in a UK survey reported that they were of the habit of chewing gums and in general too, people chew gums to overcome stress, focus better and hide away their anxiety but there are a number of factors through which chewing gum might affect stress, alertness and cognition including the duration for which you chew the gum. So, while it is ok to occasionally chew a gum that’s sugar-free regularly indulging in this habit is not recommended until we have stronger evidences proving their benefits 100%. References Chewing & Attention: A Positive Effect on Sustained Attention: https://www.ncbi.nlm.nih.gov/pmc/articles/PMC4449948/ Chewing Maintains hippocampus-dependent cognitive function: https://www.ncbi.nlm.nih.gov/pmc/articles/PMC4466515/ Gum Chewing & Cognition-An Overview: https://file.scirp.org/pdf/NM20120300003_99040712.pdf A Review of Evidences that Chewing Gum Affects Stress, Alertness & Cognition: http://psych.cf.ac.uk/home2/smith/206.pdf  Instant Noodles: Tasty but a Hasty Decision Taken Despite the fact that instant noodles came under the radar for its debilitating effects on human health it is back with a bang and sales too haven’t witnessed a dip in recent times. Even a 10-year-old can prepare instant noodles in a jiffy. Kids of any age group love it when it’s time for their noodle treat and parents too don’t mind giving it to their children as the dish is cheap, convenient and tasty. It’s preferred by travelers, bachelors and those staying in hostels as all that you need to prepare it is a cup of hot water. Born in Japan, this dish has gained supremacy over the entire world with its overload of preservatives and empty calories. Indeed, this so-called super dish does have its own share of disadvantages.
It all boils down to the food that we eat finally. Unhealthy dietary choices such as high intake of junk foods and soft drinks and inappropriate lifestyle practices decide upon our quality of life. Instant noodles is mostly consumed in higher quantities in Asian countries, especially South Korea which tops the consumption list consuming more than 4 billion packets. We do know that noodles aren’t good for health but what exactly does their consumption do to our body? Hypertension is a great risk factor for heart disease, stroke and kidney failure and South Korea has more than 29% of adults aged above 20 years suffering from it. Asians including Koreans eat more of carbohydrates. Though the consumption of rice (staple food of Asians) has decreased in the previous few years the consumption of bread and noodles has almost doubled. Maybe instant noodles do contribute towards the increased risk of hypertension as it is indeed a refined grain product. We are well-aware that diets such as the DASH diet that comprise more of whole grains, low-fat dairy, vegetables and fruits are good for reducing hypertension. We do have studies supporting the fact that higher intake of whole grain products decreases risk of hypertension. This induced a group of researchers to analyze the relationship between refined grain intake and risk of hypertension during 8 years of follow-up data. Cohort Study on Korean Adults The study included 10,030 Korean adults aged between 40 and 69 years and baseline data was collected from 2001 to 2002 and then follow-up data was conducted every 2 years over an 8-year period. 5,012 participants were excluded from the study based on different criteria such as presence of hypertension, cardiovascular disease and cancer and other criteria. Finally, 5,018 individuals (2,439 men and 2,579 women) were involved in the study. Each of the participants were asked about their frequency and portion sizes of food consumption during the previous year. Frequency was classified into one of the nine categories: never/seldom, once/month, 2-3 times/month, 1-2 times/week, 3-4 times/week, 5-6 times/week, once/day, 2 times/day and 3 or more times per day. Portion sizes were classified into three categories: 1/2 serving, 1 serving and ≥2 servings. Portion sizes was multiplied by the frequency of consumption. Refined grains were classified into three groups -white rice, noodles and bread with each of them having different varieties under their consumption. Noodles consumption was divided into five categories (never, 0-<1, 1-<3, 3-<5, ≥5 servings/week). BP measurements were taken twice and the average was considered. Systolic and diastolic blood pressure measurements (SBP and DBP respectively) were taken and hypertension was defined as having SBP ≥140 mmHg or DBP ≥90 mmHg. Participants were followed up for around 72 months and the follow-up rate was 64%. During this period, 1377 (710 men and 667 women) of the 5,018 participants were declared to be hypertensive. Comparatively, those who suffered from hypertension were those participants who were probably older, mostly men, had lower incomes, current smokers, less educated, had higher BMI and ate less of fruits and vegetables compared to those who did not acquire the problem. Results showed that:
Cardiometabolic Risk Cardiometabolic risk factors are rapidly increasing in South Korea and so are overweight and metabolic syndrome rates. All these are critical risk factors for cardiovascular disease. Once again, our dietary choices affect the risk rate of these diseases. There has already been results from a study reporting increased risk of cardiometabolic risk factors associated with a dietary pattern high in consumption of instant noodles, hamburgers and pizza in the Korean men population. The study cited below tried to find a link between instant noodles consumption, dietary patterns and cardiometabolic risk factors with the help of the Korean National Health and Nutrition Examination Survey (KNHANES) cross-sectional study. Though more than 24000 participants’ data was initially collected only 10,711 of them qualified for the study based on different study criteria. Food frequency questionnaires (FFQs) were given to participants asking them to choose between 10 frequency responses ranging from ‘almost never’ to ‘3 times a day’ for 38 different food items. Waist circumference, blood pressure, mean systolic and diastolic pressures, total cholesterol, fasting glucose, LDL and HDL cholesterol levels were also measured. Using the guidelines from the International Diabetes Federation metabolic syndrome was defined as abdominal obesity (waist circumference ≥90 cm in men and ≥ 80 cm in women) along with any of the two criteria among these-elevated blood pressure levels, low HDL cholesterol, hyperglycemia and hypertriglyceridemia. Intake of instant noodles was divided into five categories (<1 time/month, 1 time/month, 2-3 times/month, 1 time/week and ≥2 times/week). Two different dietary patterns were observed in both men and women-traditional dietary pattern (TP) that is rich in fruits, vegetables, fish, legumes, potatoes, grains, mushrooms and seaweed and meat and fast-food pattern (MP) consisting of less rice and cereal but more of meat, soda, fried food, instant noodles, bread, cookies, fish, pasta, ice cream, hamburgers and pizza. Those with the highest quintiles of MP also had a higher frequency of instant noodle intake (2 times/week in men and 1.2 times/week in women) compared to the highest quintiles of the TP (mean of 1.1 times/week in men and 0.7 times/week in women). Results showed that:
Effect on Young Individuals Yet another study was conducted on 3,397 (1,782 males and 1,615 females) students aged between 18 and 29 years. They were all asked to fill a questionnaire comprising of details on the age, height, weight, income, smoking, drinking and physical activity levels. The questionnaire also included a question on the frequency of instant noodles consumption over a 1-year period and frequency of other foods consumption such as processed meats, high-fat fish, sweets and confectionary. Results showed that males were likelier to frequently consume instant noodles (≥3 times/week) than females. Such individuals smoked more, drank more alcohol, ate more fried foods and confectionary and earned a lesser family income. These people also suffered from increased blood pressure and fasting blood glucose levels. In females, triglyceride levels and diastolic blood pressure levels were higher among frequent consumers of instant noodles. Also, college students who frequently consumed noodles were associated with an increased risk of cardiometabolic risk factors. Researchers at Harvard University reported a 68% higher risk of metabolic syndrome among women who consumed instant noodles more than twice a week but this was applicable to women. Most of the instant noodles are deep-fried contributing to increased calorie counting and carbohydrate consumption. Regular noodles are bad but instant noodles are worse as they are mostly prepared using palm oil and full of salt, artificial flavors and preservatives. It might be delicious compared to your regular noodles but it is also equally harmful. While it is recommended to avoid noodles if you must eat them please choose regular ones as they are not as bad as the instant ones though it might take an extra 5 minutes or so. References Noodle consumption is positively associated with incident hypertension in middle-aged and older Korean women: https://e-nrp.org/Synapse/Data/PDFData/0161NRP/nrp-13-141.pdf Instant Noodles Intake and Dietary Patterns are Associated with Distinct Cardiometabolic Risk Factors in Korea: https://academic.oup.com/jn/article/144/8/1247/4637708 Instant Noodle Consumption is Associated with Cardiometabolic Risk Factors among College Students in Seoul: https://pdfs.semanticscholar.org/9d31/c5dd2bd02bcb4a02da4da168c2d75fc9440f.pdf  People Mostly Eat at their Desktop without Washing their Hands It might be your office workspace but it does exist as your dining space as well. More than the air of authority and distribution of work we get the strong smell of garlic and onion doing rounds in our cabins! It might seem to save your time and efforts but what about your colleagues around? Do they also enjoy sharing their workspace with veggies, fruits and the pungent garlic smell? There is also a common misconception among people that working 24*7 is the best way for increments and promotions coming their way and the employers too are to be blamed for this. Seeing an employee around the corridor, leaving early from work or having fun during lunch brings in the delusion that the person is not doing effective work. We have been nurtured in a society that strongly believes in sticking by the rules, adhering to timings and treating the boss as though he is way above the rest! Working extra hours, pumping in more efforts to complete a project or pursuing multiple projects at the same time is not wrong as it gives you ample opportunity to learn but taxing yourself too much and working while being completely stressed is unhealthy. To remain in the good books of our employer, to save time and to focus on multiple projects simultaneously many employees have now started practicing desktop dining where he/she eats at his/her own desk rather than moving to the cafeteria or food court for lunch and snacks. This brings us to look into this issue and decide upon its effect on our productivity and health!
There have been research studies previously that talk about the negative consequences of eating while watching television or talking over phone (visual or auditory distraction). We do have evidences showing that watching tv and eating lead to higher energy intake compared to listening to music and having food. Likewise, listening to some story and eating too lead to increased energy intake compared to eating alone. Similar are the effects of playing video games, meddling with smartphones or having any other distraction while eating than eating in the absence of these. Our energy intake depends on how much we strain our cognitive skills too! When you do hard math problems, solve complex chemical equations or complete a task within a strict deadline it leads to increased energy intakes compared to solving easy math questions or simple tasks at office. Due to overburdened work, less workforce and more pressure there is this latest trend among employees to eat while working. We don’t have studies that show the effect of such practices on energy intake and one research group has pursued this study and come up with surprising results. Desktop Dining’s Impact on Energy Intake The study included 43 participants all of whom were between 18 and 65 years of age and ate food regularly while working. There were two conditions-the mental work condition and the control condition experimented on the participants on weekdays between 11 am and 12 pm inside a sensory laboratory. In the control condition the participants were asked to eat their food in isolation while during the working condition they were asked to perform a computer-based activity (this included copying columns of numbers from data files to a master file over a 20-minute period) while eating their meal (which consisted of a pizza). Forty of the participants participated in both the tasks which were conducted with a 1-week interval but at the same time and day of the week. The pizza contained high calories (5848 kJ) contributing to 223 g of carbohydrates, 28 g fat, 52 g protein, 9.6g sugar and 3.368 g sodium and this pizza was consumed by every study participant in the stipulated 20-minutes time. The pizza was weighed before and after consumption and the energy intake (kJ) was calculated based on the difference in weight of the pizza consumed. All the participants were asked to eat their breakfast and fast for two hours (unlimited water consumption was permitted) before the study. Upon arrival each of the volunteer’s height, weight and waist circumference was measured and they were asked to fill a Dutch Eating Behavior Questionnaire (DEBQ) to find out whether they were emotional, restrained or external eaters. BMI and waist measurements helped in determining the physiological and behavioral response to satiety, appetite and hunger between lean, overweight and obese participants. Scores ≥3 were restrained eaters while those with restrained scores lesser than three were non-restricted eaters. Anxiety levels were measured using State –Trait Anxiety Inventory Questionnaire (STAI) whose scores were from 11 to 52 with greater scores indicating increased anxiety levels. Single-item stress scale measured the participant’s present stress levels ranging from 0 to 10 with higher numbers indicating greater stress levels. It is possible that participants might be stressed while eating and completing a task and change in stress levels before and after eating pizza under two consumption conditions might contribute towards differences in satiety and pleasantness levels. The Visual Analogue Scale (VAS) helped evaluate satiety levels by measuring hunger and fullness. All these measurements were taken before eating the pizza and once they consumed the pizza each of the participants’ stress and satiety levels were measured again. After this, once again a new pizza was presented but this was not for eating purpose but simply the participants had to assess pleasantness and palatability by looking at it. While both the conditions went through the same protocols the only difference was that the participants were either given a task while eating or ate the food without any distraction. Each of the participants were aged around 25.79±4.87 years of age, BMI and waist circumference were 21.75±2.75 and 76.08±7.25; DEBQ scores for dietary restraint, emotional eating and external eating scores were 2.46 ± 0.77, 2.49 ± 1.04, and 3.28 ± 0.49 respectively and STAI scores were 26.09 ± 8.53. Results showed that:
Attentive Eating Mindfulness and attentive eating have become critical to weight loss hopes and diet plans to work out. Putting off distractions, being aware of what you eat and reminding yourself of what you ate during the day are all helpful in decreasing food intake during the next meal or snack. Studies too show that eating attentively controls food intake, monitors your portion intake and incorporates attentive-eating principles to facilitate weight loss and maintain body weight without the need for taking time separately for calorie counting. There are study results showing that watching TV and eating increase consumption by almost one third. Already we are living in a world which is used to sedentary lifestyles-too much of sitting with too little of exercising. When we combine this with desktop dining the number of hours spent sitting down skyrocket. Taking a break in between and stretching your hands and legs every hour or so keeps your body flexible. Stress management by practicing yoga is beneficial to the body. A desktop dining survey conducted in 2011 shows that 52% bring lunch from home and eat it, 27% bring lunch from home and eat it elsewhere, 23% bring lunch from cafeteria/restaurant and eat it at their desk while 21% eat at a restaurant or cafeteria. It was also found that cleanliness was not maintained with desktop dining. Only 50% surveyors told that they washed their hands before consuming food which is a depressing number. All said and done, what is the need to eat at the desk? Instead, why don’t you go to the food court and enjoy your food prepared with love and affection? This brings in ample opportunities for movement, you get a chance to take a walk, do some stretches and free your mind off the stress that’s been lingering around since the start of day at office. Breathe some fresh air, feel refreshed and get back to work to with a positive outlook and a healthier body. References How is Satiety Affected when Consuming Food while Working on a Computer? https://www.mdpi.com/2072-6643/11/7/1545/htm Eating Attentively: A Review of Food Analysis of Intake Memory and Awareness on Eating: https://www.ncbi.nlm.nih.gov/pmc/articles/PMC3607652/ Desktop Dining Survey: http://www.eatright.org/~/media/homefoodsafety/multimedia/downloads/desktop%20dining%20executive%20summary%20final.ashx  Age-related Hearing Loss is Inevitable but can Be Significantly Reduced with Better Nutrient Intake  Don’t Make the Elderly People Feel Embarrassed for their Hearing Loss Don’t Make the Elderly People Feel Embarrassed for their Hearing Loss Loud music, jarring instruments and pool-side parties with blasting movie songs seem recreative and peppy. At home too, we love to keep the television volume above everything else and this includes our voices too! Children who follow the footsteps of parents pursue the same ending up keeping high volume on their Chota Bheem and Spider Man series! Such prolonged days and years of high volume affects our hearing power ultimately. Apart from that ageing (age-related hearing loss increases from 30% around the age of 65 to 80% in those aged 80 and above) too plays a turmoil mon our auditory capacity. HL can be the result of genetic and environmental factors that’s extremely difficult to handle. Genetic factors include mutations in genes or certain factors that affect the development of the cochlea (part of the inner ear involved in hearing) and environmental factors involve exposure to noise (as in the examples given above), prolonged use of listening devices, ototoxic drugs such as antibiotics, anticancer drugs and painkillers or nutritional deficiencies. Individuals are having a longer life expectancy and hence, more people are believed to suffer from hearing problems. World Health Organization states that more than 450 million people worldwide (almost 5.3% of the world population) suffer from hearing loss (HL) and according to a research in New Zealand this ratio is believed to increase to 7.02% in 2061. Almost 900 million people would not be able to hear properly around 2050. We crib and complain about diabetes and dementia but HL has embarked on a journey to push past these prevalence rates and reach higher positions in life.
HL is agonizing both to the person involved and the opponent facing the HL individual. People with HL often face issues of seclusion, isolation, loneliness, stress, anxiety, lower self-esteem and try to forge their understanding of issues and problems which decreases their quality of life to a great extent. Nutrient-based Actions Against HL Research shows that more than 60% of HL in kids can be prevented through effective public health measures while around 50% with vaccines for rubella, mumps, measles and meningitis. There are several research evidences available showing that an unhealthy lifestyle and diet measure can have debilitating effects on hearing quality that includes sedentary behavior, minimal exercise routines, higher obesity rates and deficiency of essential nutrients. Bringing in healthier diet changes, implementing nutrition-based therapies and overcoming micro- and macronutrient deficiencies take us a step closer towards overcoming hearing loss. The human ear is divided into three compartments namely outer, middle and inner ear. Depending on where the loss occurs HL is grouped as conductive (middle or external ear), sensorineural (inner ear or auditory nervous system) and mixed. The magnitude of loss depends on the range of decibel of hearing level. Effects of Calorie Restriction Ageing increases the need to restrict calorie (CR) and diet (DR) intake while maintaining nutrient intake. CR helps in reducing the risk of obesity, diabetes, tumors, cholesterol, blood pressure and inflammation. Studies have proved that weight loss is not sufficient to enhance hearing potential. Auditory tests were performed in Rhesus monkeys (aged between 18 and 20) after 12-13 years of feeding them with 30% lower (CR) amount of the same diet that they consumed but results showed no differences in hearing. Another diet fed the animals with a 70% lower calorie diet supplementing them with vitamins and minerals after 8-13.5 years of follow-up also showed no changes in HL when the animals had a mean age of 205 years. A study by the University of Wisconsin maintained 30% less calories than control group for 3 to 9 years in animals aged between 11 and 23 years and this showed better auditory function. An analysis between all three tests showed that the monkeys had not yet reached an age wherein age-related HL shows up. Macronutrients Its been proven that a diet rich in carbohydrates affects HL not because of the macronutrient content of the diet but due to triglyceride (TG) levels which elevate the individual’s HL risk (owing to high glycemic index, glycemic load and total carbs levels). Lipids effect on HL was measured by providing two hospitals with two different diets for a period of 5 years-first one was given a high saturated fat diet and the second with high polyunsaturated fat diet. Results showed that the total number of individuals showing auditory impairment was lower in the second hospital providing polyunsaturated fat diet. Diets of both the hospitals were exchanged and after four years the inverse result was obtained showing that hearing functionality improved with an unsaturated fat diet but decreased with higher intake of saturate fats. Also, intake of fish rich in omega-3 fatty acids helped in reducing incidence rates of HL when the intake is between 1 and 2 servings of fish every week as higher intakes did not guarantee improvements in hearing functionality. Micronutrients Vitamins are actually needed for proper functioning of the ear and hence, their consumption would also help in preventing hearing loss. Their effectiveness has been attributed to their antioxidant property that safeguards the cochlea from increased levels of ROS produced during and after noise exposure. Many studies show the benefits of vitamins in overcoming noise-induced hearing loss (NIHL) while some have linked it with drug-induced ototoxicity. Hence, consuming a diet rich in vitamin C, E and A provide you with better ability to fight against NIHL. Magnesium, a mineral found in nuts and dried fruits fights against free radical formation and hence, against noise-induced vasoconstriction. A Korean study performed an analysis on more than 3200 individuals aged between 50 and 80 years on the effects of dietary intake of vitamin D and vitamin D serum concentrations in auditory function. Carotenoid, retinol, riboflavin, thiamin, niacin and vitamin C intake was assessed by means of a 24-h recall. More the intake of vitamin C better was the hearing capability in the midfrequency range. A study of French adults showed that high intake of retinol and vitamin B12 was associated with a better auditory function in women only while there was no effect after the consumption of folate, beta carotene and vitamins B6, E and C. Increased consumption of meat, red meat and organ meat also led to better hearing levels in women while consumption of seafood and shellfish improved hearing levels in men. Vitamin A is generally required for the normal development of the inner ear and the impact of its absence depends on the level of deficiency. Lack of enough vitamin A levels increases the risk of otitis media, a group of inflammatory diseases of the middle ear. But we have only one study showing that vitamin A supplementation improves auditory function and we need further research to prove it. Minerals Studies show that decreased iron intake increases the risk of HL. Iodine deficiency too has similar effects on individuals increasing the risk of HL. High-potassium Diet & its Effects on Hearing Threshold One study focused on the impact of potassium and recruited 5925 participants for the study. Age, sex, presence of diabetes mellitus, smoking and drinking habits, education level, exposure to increased noise and dietary measurements were taken. The study which majorly comprised of women (57.1%) showed that the mean age was greater in the case of men. All nutrients witnessed greater intake in men compared to women. Mean age and total number of participants with diabetes mellitus was highest in the third quartile group while education level, protein and fat intake were low in the lower quartile group. Potassium is critical for cell growth and maintenance of cell membrane potential. A diet usually high in potassium minimizes effects of cardiovascular diseases by increasing diuresis and decreasing smooth muscle proliferation and free radicals. The study split participants into tertile groups depending on the consumption levels of potassium. The prevalence of HL in low, middle and high tertile groups was 15.3%, 11.1% and 7.8% respectively. Compared to participants in the high tertile group those in the low tertile group exhibited a 2-fold increase in risk for HL and those in the middle tertile group exhibited a 1.472-fold higher risk for HL. Intake of high potassium levels was associated with a lower prevalence of HL. We need further studies to show whether improvements in potassium intake might prevent hearing impairments in individuals. Nutrients play an important role in maintaining hearing levels in adults. While calorie restrictions don’t show promising results as of now increasing the intake of macronutrients and micronutrients has a significant effect on the occurrence and progression of HL. Hearing loss is becoming more and more important as the proportion of elderly population are tremendously increasing in number. We need significant therapies and preventive protocols to improve quality of life of these people. References Interplay between nutrition and hearing loss: https://www.ncbi.nlm.nih.gov/pmc/articles/PMC6356655/ Association between a high-potassium diet and hearing threshold in Korean adults: https://www.nature.com/articles/s41598-019-45930-5 |
AVOID FRAUD. EAT SMART
Member - Academy Of Nutrition & Dietetics. USA
+91 7846 800 800 
|
- Home
- Written Testimonials
- Consult
- Clinics
- Blogs
-
Diet & Nutrition
- Diabetes Reversal
- IVF IUI not needed for PCOS PCOD Infertility
-
Medical Nutrition
>
-
Disease & Conditions
>
- Infertility | PCOS
- Diabetes Mellitus
- Cholesterol
- Hypothyroid
- Kidney Problems
- Hypertension
- Cardiovascular Diseases
- Liver Diseases
- Gastro intestinal disorder
- Cancer
- Metabolic Disorders
- Orthopedic Disorders
- Eating Disorders
- Dietary Recall
- Weight Record Filled By Clients
- Online Payment Transaction Details
- Online Clients Weight Check Form
- Our Program Package Service Charges
- Weight Record 2017 Clients
- Measurements sent by Clients
- Terms & Conditions Of Payment
- Thanks. Your Form is Submitted
- Video Testimonials
- Lifestyle & Wellness
- Lifestyle & Wellness Blog
- Allergy & Intolerance
- Weight Loss / Gain
- Weight Loss / Slimming Blog
-
Disease & Conditions
>
- Life Cycle Nutrition >
- Sports Nutrition >
- Integrity in Nutrition
- Knowledge Centre
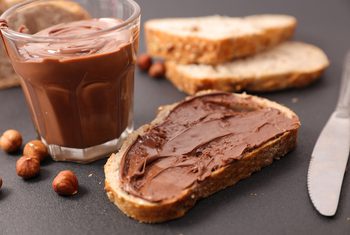

© COPYRIGHT 2022. ALL RIGHTS RESERVED. FRST HEALTHCARE PVT LTD.
Dr. Nafeesa Imteyaz of First Eat Right clinic, is the Best Dietitian Nutritionist in Bangalore. Best Dietitian Nutritionist in Pune. Best Dietitian Nutritionist in Hyderabad. Best Dietitian Nutritionist in Chennai. Best Dietitian Nutritionist in Mumbai. Best Dietitian Nutritionist in Delhi. Best Dietitian Nutritionist in Kolkata.